Category: Runtime internalsSeries · part 4 of 4
A 1 MiB goroutine stack costs 136µs and reports 144 B/op
Reaching a 1 MiB stack copied it nine times. The copying cost 136µs of CPU that -benchmem reports as 144 bytes, because stack memory is not heap memory.
TL;DR
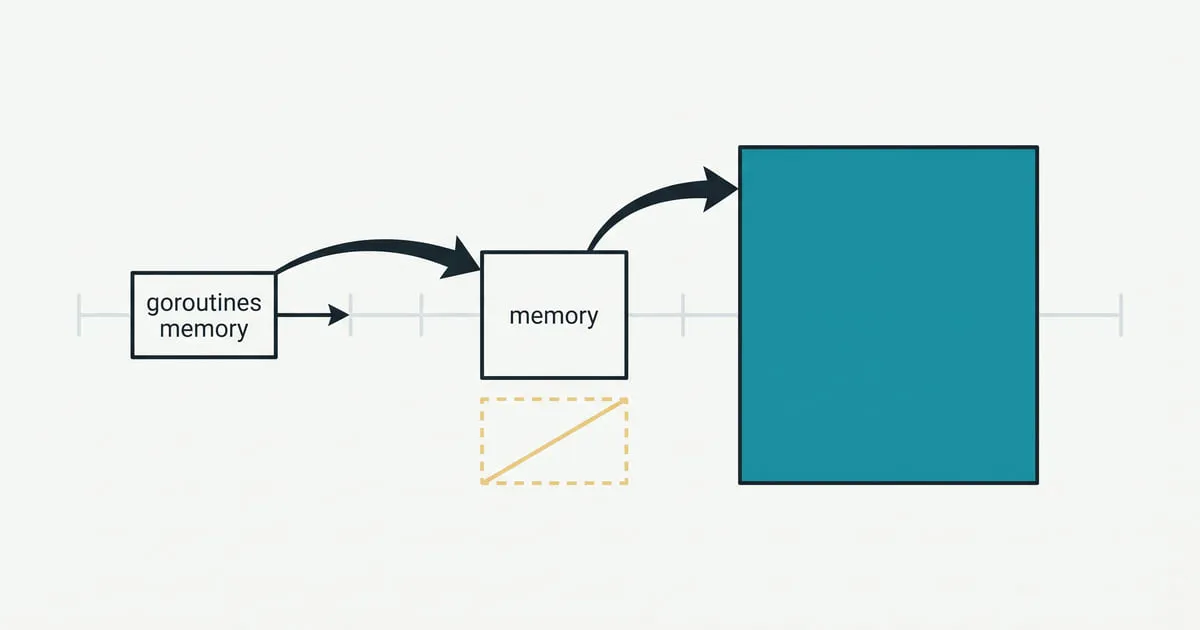
- A goroutine's stack is never resized in place. It is allocated elsewhere, copied into, and the old one is released — nine times on the way from 2 KiB to 1 MiB.
- The nine copies moved 1013 KiB in total and cost 136µs on top of the work itself, isolated by running the same descent on a reused goroutine and on a fresh one.
- -benchmem reported 144 B/op at depth 1 and at depth 4096. Stack memory is not heap memory, so no allocation profile in Go shows any of this.
- The headroom the runtime keeps is exact rather than approximate: the tightest measured gap was 928 bytes, which is stackNosplit + stackSystem + abi.StackSmall on this platform.
- A pointer to a local survived all nine copies and still read 42, having moved 3.4 MiB. The uintptr taken from that same address beforehand did not move at all.
Reaching a 1 MiB stack copied it nine times and cost 136µs. -benchmem
reported 144 bytes.
Both numbers came out of the same benchmark. Stack memory is not heap memory, so
none of that copying appears in B/op, in allocs/op, or in an allocation
profile — the tooling most people reach for is structurally blind to it.
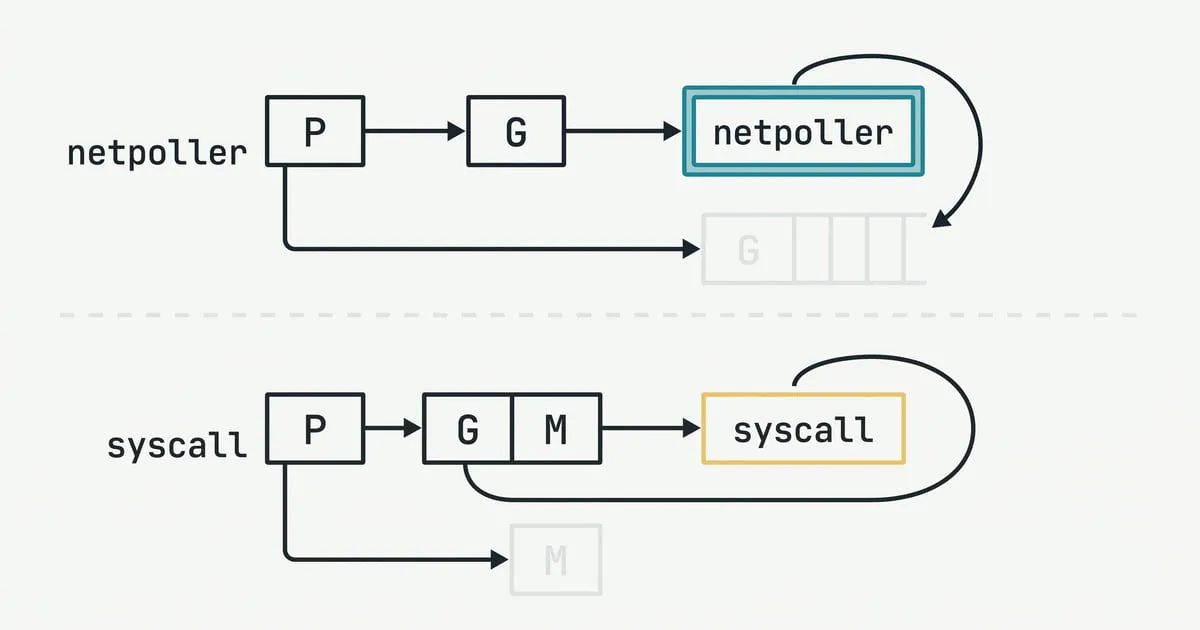
The scheduler post left two hundred
goroutines parked in read(2), each still owning its stack. This is what owning
one costs when it gets deep.
The doubling, measured
Everything below is go1.27.0 darwin/arm64 on an Apple M4 Pro, 12 cores,
macOS 26.6.2. The harness is in the
experiments repository.
A goroutine starts at 2 KiB — stackMin = 2048.
That is the floor, not the answer. To find out where it stops being the answer,
recurse and record the address of a local at every level:
//go:noinline
func Descend(depth int, addrs []uintptr) {
	var frame [FrameBytes]byte
	addrs[depth] = uintptr(unsafe.Pointer(&frame))
	frame[0] = byte(depth)
	if depth+1 < len(addrs) {
		Descend(depth+1, addrs)
	}
	sinkByte = frame[0]
}
Frames inside one stack sit a constant stride apart. A stride that is not that constant means the frames are somewhere else now:
go build -o /tmp/stacklab ./stacks/main
/tmp/stacklab growth 4096
local array 128 bytes, frame stride 176 bytes, depth 4096
copy at depth frames live vs previous
1 6 1.0 KiB
2 18 3.1 KiB 3.00x
3 41 7.0 KiB 2.28x
4 87 15.0 KiB 2.12x
5 180 30.9 KiB 2.07x
6 367 63.1 KiB 2.04x
7 739 127.0 KiB 2.01x
8 1484 255.1 KiB 2.01x
9 2973 511.0 KiB 2.00xNine copies to get from 2 KiB to 1 MiB, each triggered at roughly twice the live
bytes of the last.
newsize := oldsize * 2
is the whole rule, and the loop below it keeps doubling when one doubling is not
enough for the frame that asked.
Parking a goroutine at a fixed depth and reading runtime.MemStats.StackInuse
from outside it confirms the sizes independently:
depth    frames       stackinuse
256      32.0 KiB     64.0 KiB
512      64.0 KiB     128.0 KiB
1024     128.0 KiB    256.0 KiB
2048     256.0 KiB    512.0 KiB
4096     512.0 KiB    1.0 MiB
8192     1.0 MiB      2.0 MiB
Below 32 KiB that column is useless — StackInuse counts whole spans, so a
2 KiB stack disappears into one. Above it, the two probes agree exactly.
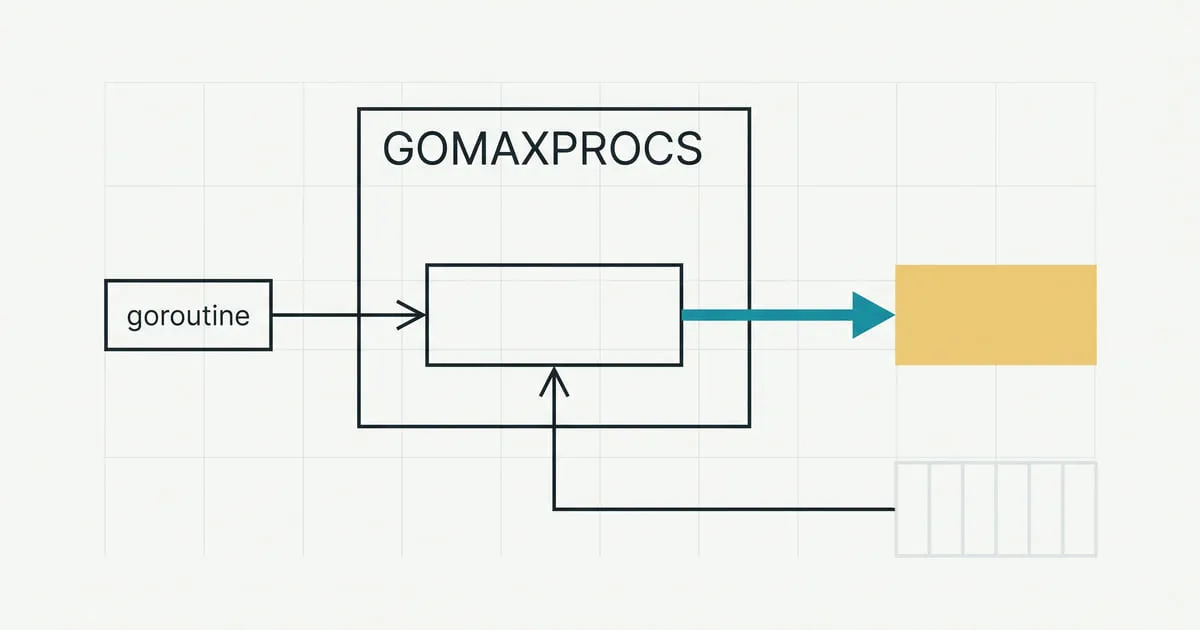
Note what this memory is not governed by. Two hundred goroutines at this depth
would hold 200 MiB of stack, and
GOMAXPROCS bounds none of it — it
bounds how many of them may execute Go code at once, not how many exist or how
much stack each one has taken.
Where the runtime draws the line
The copies do not happen when the stack is full. They happen when the next frame
would cross a reserved band at the bottom, and that band is a constant:
stackGuard = stackNosplit + stackSystem + abi.StackSmall.
On darwin/arm64 that is 800 + 0 + 128 = 928 bytes.
Subtracting the live bytes at each copy from the stack size it was using:
| copy | stack | frames live | headroom left |
|---|---|---|---|
| 1 | 2 KiB | 1056 B | 992 B |
| 2 | 4 KiB | 3168 B | 928 B |
| 3 | 8 KiB | 7216 B | 976 B |
| 4 | 16 KiB | 15312 B | 1072 B |
| 5 | 32 KiB | 31680 B | 1088 B |
| 9 | 512 KiB | 523248 B | 1040 B |
The tightest is 928 exactly. Every other row is 928 plus something smaller than one 176-byte frame — the overshoot from the last frame that did fit. The reserve is not approximately a kilobyte; it is a constant the source names, and the measurement lands on it to the byte.
What one growth costs
The cost is harder to isolate than the schedule, because a fresh goroutine pays for its own creation as well as for its copies. So measure the same descent two ways: on a worker goroutine that has already grown its stack, and on a goroutine created for the call. Subtracting the depth-1 case from each removes the fixed overhead of both.
The harness carries a control pair for the reason
a benchstat delta is not evidence on its own:
warmctl is byte-for-byte the same benchmark as warm, and it brackets fresh
so that it spans at least as much drift as the comparison it validates.
go test -run=^$ -bench='Warmup|Descend' -benchmem -count=10 ./stacks/ \
  | grep -v Warmup | benchstat -row /depth -col /goroutine -
│ warm │ fresh │ warmctl │
│ sec/op │ sec/op vs base │ sec/op vs base │
1 177.8n ± 1% 225.4n ± 0% +26.84% (p=0.000 n=10) 178.0n ± 1% ~ (p=0.271 n=10)
16 225.2n ± 1% 673.1n ± 1% +198.91% (p=0.000 n=10) 225.2n ± 2% ~ (p=0.591 n=10)
64 714.7n ± 1% 3133.5n ± 1% +338.44% (p=0.000 n=10) 711.1n ± 0% ~ (p=0.143 n=10)
256 2.092µ ± 1% 13.102µ ± 2% +526.29% (p=0.000 n=10) 2.102µ ± 1% ~ (p=0.210 n=10)
1024 8.381µ ± 0% 46.923µ ± 2% +459.90% (p=0.000 n=10) 8.373µ ± 2% ~ (p=0.796 n=10)
4096 32.84µ ± 0% 169.06µ ± 2% +414.75% (p=0.000 n=10) 32.84µ ± 0% ~ (p=0.403 n=10)The control is ~ at all six depths and +0.00% on the geomean, so the fresh
column is not the harness talking. Taking the difference of differences against
depth 1, and reading the copy count and the bytes moved off the growth table:
| depth | copies | bytes copied | cost of the copying | rate |
|---|---|---|---|---|
| 16 | 1 | 1.0 KiB | 400 ns | 2.6 GB/s |
| 64 | 3 | 11.2 KiB | 2.37 µs | 4.8 GB/s |
| 256 | 5 | 57.1 KiB | 10.96 µs | 5.3 GB/s |
| 1024 | 7 | 247 KiB | 38.49 µs | 6.6 GB/s |
| 4096 | 9 | 1013 KiB | 136.17 µs | 7.6 GB/s |
136µs to reach a 1 MiB stack, against 33µs for the same 4096 calls once the stack is already there. The copying is four times the work it exists to support. The rising rate is the fixed per-copy cost — a few hundred nanoseconds of allocating, walking and releasing — being spread over more bytes, not a bandwidth ceiling.
And in the B/op column of that same run: 144.0 ± 0% at depth 1, and
144.0 ± 0% at depth 4096. Those 144 bytes are the channel and the closure the
benchmark itself allocates. Not one byte of the megabyte shows up.
The pointer the runtime rewrites
Copying a stack means every pointer aimed into the old one is now aimed at freed memory. The runtime fixes this: it walks each frame using the layout the compiler recorded and rewrites the pointers. That is the expensive half of a copy, and it is also the reason Go can move a stack at all while C cannot.
It has a consequence you can measure. Take the address of a local, copy the same
address out into a uintptr, then force the stack underneath both to grow:
anchor := 42
p := &anchor
r := Rewritten{Before: uintptr(unsafe.Pointer(p))}
stale := r.Before // a plain integer from here on

addrs := make([]uintptr, depth)
Descend(0, addrs) // nine copies
stack copies during the descent: 9
address before the descent: 0x114003a81710
pointer after the descent: 0x114003ddff10 (moved 3.4 MiB)
uintptr taken before it: 0x114003a81710 (unchanged: true)
value read through the pointer: 42p was rewritten nine times and still reads 42. stale holds an address that
has not been valid since the first copy, and nothing warned about it — it is an
integer, and the runtime has no way to know what it means. The addresses differ
on every run, but the shape does not.
This is what the unsafe documentation is protecting when it says that “both
conversions must appear in the same expression, with only the intervening
arithmetic between them”. The reason usually given is the collector — “the
garbage collector will not update that uintptr’s value if the object moves”. A
stack copy moves things too, and it does not need a collector to do it.
What this does not cover
Shrinking. The runtime halves a stack during a GC scan only “if gp is using less than a quarter of its current stack”, which means a long-lived goroutine can pay for the same growth more than once. That is a different mechanism on a different schedule and it needs its own measurement.
The bytes-copied column counts frames only. The runtime also moves whatever sits below them — the goroutine entry frames and the channel wait — which is a few hundred bytes it does not credit, so the rates above are slightly conservative.
And the frame here is a 128-byte array, which makes a clean stride and an unrealistic function. A real deep call chain has frames of varying size, and the schedule depends on the sizes of the frames that happen to ask.
Whether any of this is worth your attention is a question one machine cannot
answer, but somebody has answered it at scale: a proposal filed in March 2026
puts stack growth at 3.9% of fleet cores against the collector’s
7.3%, with 334 of 600 services above
3%. The collector has a trace, a GODEBUG and a decade of writing about it.
Stack growth has 144 B/op.
Frequently asked
Why does a stack copy cost anything if it is just memcpy?
It is not just memcpy. The runtime walks every frame on the old stack and rewrites every pointer that aimed into it, using the frame layout the compiler recorded. The measured rate here rises from 2.6 GB/s at the smallest copy to 7.6 GB/s at the largest, which is the fixed per-copy cost being amortised over more bytes rather than a memory bandwidth figure.
Will -benchmem or a heap profile show me stack growth?
No. Stack memory is managed separately from the heap, so it does not appear in B/op, in allocs/op, or in an allocation profile. In the benchmark below, B/op was exactly 144.0 at every depth from 1 to 4096 while the wall time went from 225ns to 169µs. A CPU profile is the tool that shows it, as time in runtime.morestack, runtime.newstack and runtime.copystack.
Is it safe to store a uintptr taken from a pointer to a local?
No, and the measurement below is why. When the runtime copies a stack it rewrites pointers; a uintptr is an integer and it is left alone. In the probe below the pointer moved 3.4 MiB while the uintptr held the old address exactly. The unsafe package documentation permits the conversion only within a single expression, and a stack copy is one of the reasons.