Category: Performance and measurement
benchstat reported p=0.000 between a function and itself
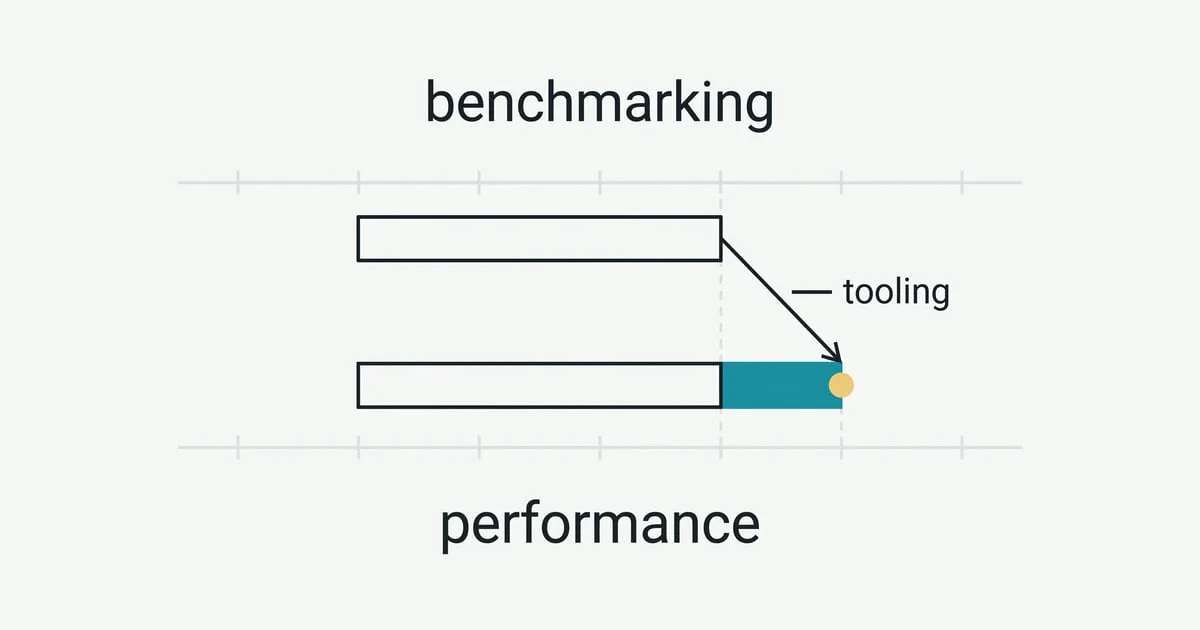
Two sub-benchmarks calling the same function with the same argument came back 1.10% apart at p=0.000. What a benchmark measures is not only your code.
TL;DR
- Two benchmarks calling the same function with the same argument were reported 1.10% apart at p=0.000, n=10. The true difference is zero.
- Raising -count did not fix it. The same identical pair came back as ~ at n=10, +1.19% (p=0.032) at n=20 and -1.36% (p=0.017) at n=40.
- At n=20 benchstat called a constructed, genuine +5% regression noise (p=0.425) and the zero-difference pair significant, in the same table.
- Reversing the execution order reproduced the timings by position rather than by code — first place cost 246.5 ns/op and third place 242.4 ns/op in both orders.
- A discarded warm-up benchmark moved the identical pair's median from -1.71% to -0.02% across 30 runs each, and recovered the real +5% from +2.99% to +4.76%.
I benchmarked a function against an exact copy of itself, and benchstat reported
the copy 1.10% faster at p=0.000.
Both sub-benchmarks call the same function with the same argument. The true difference between them is zero, and no amount of reading the output more carefully changes that. Something other than the code produced the number, and it was confident about it.
The harness
Everything below is go1.27.0 darwin/arm64 on an Apple M4 Pro, 12 cores,
macOS 26.6.2, with benchstat from
golang.org/x/[email protected]. The harness is in the
experiments repository.
Three implementations, two workloads, and the ground truth built in rather than
inferred. alpha and beta are the same call. plus5 does exactly 5% more
work:
b.Run("work=sum", func(b *testing.B) {
	b.Run("impl=alpha", func(b *testing.B) { benchSum(b, sumN) })  // 1000 additions
	b.Run("impl=beta", func(b *testing.B) { benchSum(b, sumN) })   // the same 1000
	b.Run("impl=plus5", func(b *testing.B) { benchSum(b, sumN5) }) // 1050
})
sum adds uint64s out of a preallocated slice and allocates nothing.
alloc makes 200 heap allocations of 64 bytes per operation, against 210 for
plus5. The assignment that keeps those allocations on the heap is deliberate:
without it, escape analysis
puts every one of them on the stack and the benchmark measures nothing.
So there are two correct answers, known before the machine runs: beta versus
alpha is 0%, and plus5 versus alpha is +5%.
go test -run=^$ -bench=AB -benchmem -count=10 ./benchnoise/ | benchstat -row /work -col /impl - │ alpha │ beta │ plus5 │
│ sec/op │ sec/op vs base │ sec/op vs base │
sum 246.5n ± 2% 243.8n ± 0% -1.10% (p=0.000 n=10) 254.5n ± 0% +3.25% (p=0.000 n=10)
alloc 1.730µ ± 1% 1.738µ ± 1% ~ (p=0.324 n=10) 1.824µ ± 1% +5.46% (p=0.000 n=10)The alloc row is right on both counts: ~ for the identical pair, +5.46%
for the real regression. The sum row gets both wrong in the same table.
Identical code is separated at p=0.000, and the genuine 5% regression is
under-reported as 3.25%.
More samples did not help
The benchstat documentation says to “Pick a number of benchmark runs (at least
10, ideally 20) and stick to it”. That is advice about variance, and variance is
not what is wrong here. Three sweeps, back to back on an otherwise idle machine, changing
nothing but -count:
-count |
sum, beta vs alpha |
truth |
|---|---|---|
| 10 | ~ (p=0.810 n=10) |
0% |
| 20 | +1.19% (p=0.032 n=20) |
0% |
| 40 | -1.36% (p=0.017 n=40) |
0% |
Three answers for one pair of identical functions, two of them significant, and the two significant ones point in opposite directions. Adding samples narrowed the interval around whatever the harness was producing; it did not move that number towards zero, because zero was never what the harness was aimed at.
The n=20 table is the one worth reading in full:
        │    alpha    │                beta                 │               plus5                │
        │   sec/op    │    sec/op     vs base               │   sec/op     vs base               │
sum       260.9n ± 1%   264.0n ±  1%  +1.19% (p=0.032 n=20)   280.2n ± 1%  +7.42% (p=0.000 n=20)
alloc     2.504µ ± 2%   2.372µ ± 23%  -5.27% (p=0.000 n=20)   2.501µ ± 3%       ~ (p=0.425 n=20)
On the alloc row, at the sample count the documentation calls ideal, benchstat
reported the pair of identical functions as -5.27% at p=0.000 and the real
5% regression as ~. The two verdicts are exactly swapped, in one table,
from one run.
One more comparison is worth making before leaving this section. The n=10 row
above says ~ (p=0.810). The first table in this post is the same command on
the same machine, an hour earlier, and it says -1.10% (p=0.000). Nothing
changed between them except the hour.
The benchmark is measuring its position
-count does not interleave. go help testflag describes it as running “each
test, benchmark, and fuzz seed n times”, and the output confirms the reading: all
ten alpha samples come first, then all ten beta, then all ten plus5. Each
implementation is measured inside its own contiguous block of the process’s life,
about ten seconds wide, and which block you got is the only thing about the
three that is not identical. So vary it: the harness takes a flag that reverses
the order and changes nothing else.
Normalising plus5 by the +5% it carries by construction puts all three on the
same scale:
| position in the run | forward order | reverse order |
|---|---|---|
| first | 246.5 ns (alpha) |
246.5 ns (plus5, normalised) |
| second | 243.8 ns (beta) |
244.1 ns (beta) |
| third | 242.4 ns (plus5, normalised) |
242.4 ns (alpha) |
The numbers followed the position, not the code. Reversing the order handed each slot to a different implementation and each slot kept its timing to within 0.3 ns. First place costs about 4.1 ns/op more than third place on this machine, which is 1.7% — larger than most of the deltas I have watched people argue over in review.
The normalisation is not doing the work here, and it can be checked. Comparing
plus5 and alpha at the same position — third in the forward run against
third in the reverse run — gives 254.5 ns against 242.4 ns, which is +4.99%.
The constructed ratio and the measured one agree to two decimal places, once
position is held constant.
This is also why the p-value is so confident. Ten samples taken back to back
share whatever the machine was doing during those ten seconds, so the spread
inside a block is small — ± 0% on two of the rows above. benchstat is being
handed three tight clusters and asked whether they differ, and they do. It has no
way to know that what separates them is the clock rather than the code.
Why the first block is expensive, I do not know. Frequency ramp on a laptop is the obvious guess and I have not measured it, so it stays a guess.
What fixes it
Not a larger -count. Two things, and the first one is not optional.
Measure a control pair. Register a second copy of your baseline as an extra implementation and read what benchstat reports for it. That number is your harness’s error bar for that session. Every delta in this post smaller than its control is an artefact, and you cannot tell which ones those are without one.
Give first place to a benchmark nobody reads. If the penalty belongs to the first slot, put something disposable there:
// Runs before the measured benchmarks; its result is discarded.
func BenchmarkWarmup(b *testing.B) {
	xs := data[:sumN]
	for b.Loop() {
		sinkU64 = Sum(xs)
	}
}
The control pair, measured
Thirty independent -count=1 runs without the warm-up, then thirty with it, back
to back:
go build -o /tmp/spread ./benchnoise/spread
/tmp/spread -n 30 -order=forward
/tmp/spread -n 30 -order=forward -warmupsum, beta vs alpha (truth 0%) |
min | median | max | runs calling it faster |
|---|---|---|---|---|
| no warm-up | -2.28% | -1.71% | +0.23% | 29/30 |
| with warm-up | -0.36% | -0.02% | +0.33% | 15/30 |
Twenty-nine runs out of thirty agreed that one of two identical functions was faster. That is not noise — noise would have split them roughly evenly, which is what the warm-up run does at 15/30. The median moved from -1.71% to -0.02% and the spread fell from 2.51 points to 0.69.
The real regression came back at the same time. Against a true +5%, the median
reported delta went from +2.99% without the warm-up to +4.76% with it. The
bias was not only inventing a difference where there was none; it was eating
most of a difference that was really there.
Where this stops being true
One machine, and a laptop at that: no pinned CPU frequency, no perflock, no
isolated cores. That is the point rather than a defect — it is the machine most
of these numbers get taken on — but a tuned benchmark host may have no
first-place penalty at all, and this post cannot tell you whether yours does.
The control pair can.
The two workloads behaved differently and only one of them showed the bias
cleanly. The allocating workload carried variance rather than position: the
warm-up narrowed its spread from 9.42 points to 5.57 but left its median where it
was. Whatever first place costs, it costs it to a tight compute loop and not to
an allocator under GC pressure — the kind of workload that produced the deltas in
the sync.Pool post, where the numbers
were large enough that a 1.7% floor never came up.
And the warm-up was tested in one direction only, at n=30. It is a mitigation I
measured once, not a rule.
The control pair is the part I would keep. Two extra lines, one extra column in the table, and the p-value stops being a claim about the code and starts being something you can check.
Frequently asked
Does a low p-value from benchstat mean my change made the code faster?
It means the two sets of samples are unlikely to have come from the same distribution. That is not the same claim. In the runs below, two sub-benchmarks calling the same function with the same argument were separated by p=0.000 at n=10, because the harness gave them systematically different conditions. A p-value tests for a difference between the measurements, not for a difference between the implementations.
How many -count runs are enough?
More runs narrow the confidence interval around whatever the harness is producing, including its bias. Going from n=10 to n=40 on a pair of identical functions did not converge on zero; it produced three significant answers with two different signs. The number of runs is the wrong axis when the error is systematic. Measure a control pair instead and let it tell you how large your harness's own error is.
What is a control pair?
A second copy of the baseline, registered as an extra implementation and measured in the same run as the real comparison. Its true delta is zero by construction, so whatever benchstat reports for it is your harness's error bar for that session. A change smaller than the control is not a result you can defend.