Category: Ecosystem and tooling
A 404 from net/http costs 62 allocations
A static route through net/http's mux costs 85.6 ns and nothing on the heap. A path that matches no pattern costs 2125.5 ns and 62 allocations.
TL;DR
- Dispatch is not where anyone's latency went. On a 200-route table, gin matched a static path in 23.6 ns, echo in 26.5 ns and `net/http` in 85.6 ns — against 237.1 ns for one `json.Marshal` of a five-field response body.
- A path matching no pattern is the exception. `net/http` answered one in 2125.5 ns and 62 allocations, 25 times its own static match and nine times the JSON encode.
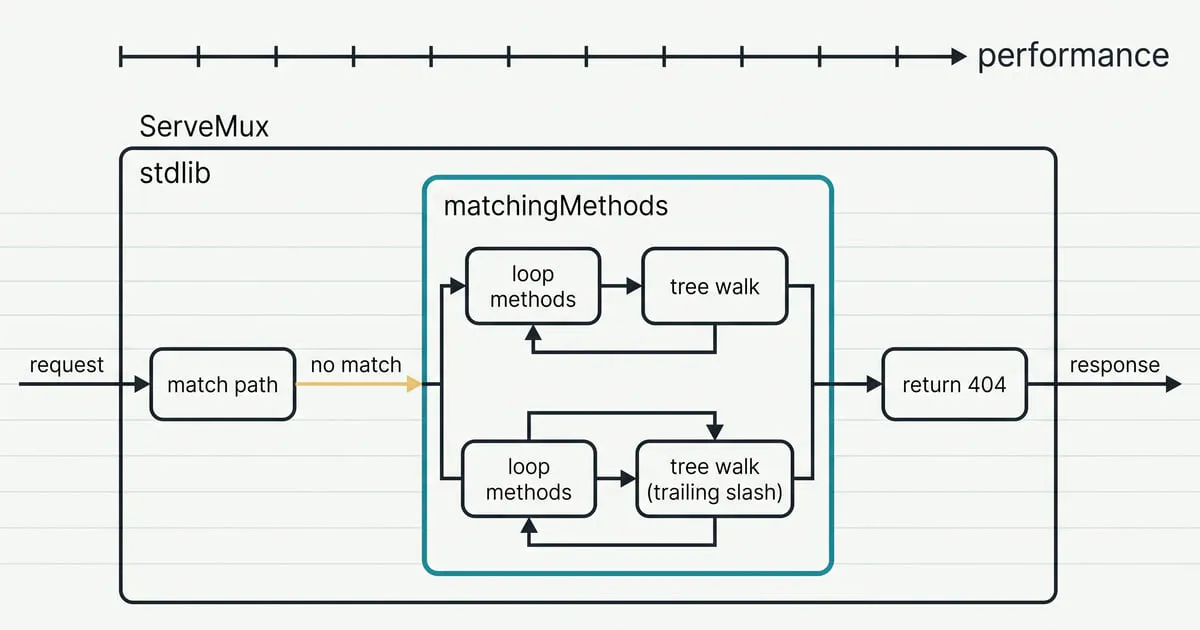
- The cost is `ServeMux.matchingMethods`, which walks the routing tree once per registered method — and then does it again with a trailing slash appended — so the mux can tell 404 from 405.
- It tracks methods, not routes. Ten times the table cost 25% more; four methods instead of one cost 56% more and 22 more allocations across the three added methods.
- Two identical `ServeMux` instances built from the same routes differed by up to 8.05% at p=0.000. That is the error bar every other percentage here has to clear.
A request that matched none of my 200 routes cost 2125.5 ns and 62 allocations. The same mux answered a static route in 85.6 ns and allocated nothing.
Router benchmarks are the most-published and least-trustworthy numbers in the Go ecosystem, mostly because the handler does real work and drowns the thing being measured. So this one has no handler at all — and a ruler beside the table, so the ranking can be read as a fraction of a request rather than as a league position.
What is being measured
All numbers: go1.27.0 darwin/arm64, Apple M4 Pro, 12 cores, macOS 26.6.2.
Benchmarks with -benchmem -count=10, summarised by benchstat. Routers are
chi v5.3.2, gin v1.12.0 and echo v4.15.4. The harness is
routers/.
One route table of 200 patterns, generated from twenty resources — collection,
item, nested and action shapes across four methods — and rendered into each
router’s own syntax. Every route carries the same empty handler. The
ResponseWriter keeps nothing: httptest.NewRecorder allocates a body buffer
and a header map per request, and that would appear in every row as the
recorder’s cost rather than the router’s.
chi.NewRouter() and gin.New() are built with no middleware. gin.Default()
installs a logger that formats a line per request, and it would be the largest
number in the table by a wide margin.
Three requests: a static path, a path carrying three parameters, and a path that matches nothing.
Dispatch, against a ruler
$ go test -run=^$ -bench='Warmup|Dispatch' -benchmem -count=10 ./routers |
    grep -v Warmup | benchstat -row /path -col /router -
│ stdlib │ stdlib-control │ chi │ gin │ echo │
│ sec/op │ sec/op │ sec/op │ sec/op │ sec/op │
static 85.57n ± 2% 82.75n ± 2% 125.65n ± 1% 23.63n ± 1% 26.47n ± 1%
param 279.65n ± 1% 264.95n ± 1% 323.55n ± 3% 45.61n ± 1% 59.77n ± 4%
miss 2125.50n ± 1% 1954.50n ± 1% 298.80n ± 1% 61.60n ± 1% 435.05n ± 1%
│ stdlib │ chi │ gin │ echo │
│ B/op │ B/op │ B/op │ B/op │
static 0.0 ± 0% 368 ± 0% 0.0 ± 0% 0.0 ± 0%
param 112.0 ± 0% 704 ± 0% 0.0 ± 0% 0.0 ± 0%
miss 1649.0 ± 0% 416 ± 0% 0.0 ± 0% 456 ± 0%stdlib-control is a second ServeMux built from the same 200 routes. Its true
difference from stdlib is zero, so whatever benchstat prints for it is this
run’s error bar — the method from
benchstat or it didn’t happen. It printed
−3.30%, −5.26% and −8.05%, all at p=0.000. That 8.05% is the widest control
gap this site has measured, and it means no comparison below about 8% on the
miss row is a result. The
mutex-versus-channel sweep is where
that mattered — a 1.37% win there was smaller than the control and did not
survive. Here it does not bite, because the gaps in this table are factors
rather than percentages.
Now the ruler. One json.Marshal of a five-field response body — an id, two
strings, a timestamp and a bool — is the cheapest useful thing a handler can do
after the router is finished:
Encode-12 237.1n ± 3% 256 B/op 3 allocs/opSo gin’s static dispatch is a tenth of a JSON encode, echo’s is a ninth, and
net/http’s is about a third. The span from the fastest router to the slowest
on a static match — gin’s 23.6 ns to chi’s 125.7 ns — is 102 ns, which is 43% of
the cost of encoding the answer, before any database, any log line, or any of
the work the handler exists to do. The likely finding was that dispatch is not
where anyone’s latency went, and that is what the table says.
Two things are still worth reading off it. chi allocates on every dispatch,
including a static one — 368 B and two allocations, which is the RouteContext
it puts in the request context. And net/http allocates only when the pattern
has wildcards to record: zero on the static route, 112 B on the one with three
parameters.
Then there is the last row.
The row nobody benchmarks
net/http answers a path that matches no pattern in 2125.5 ns and 62
allocations. That is 25 times its own static match, and nine times the JSON
encode that would have been the whole answer.
Every other router in the table treats a miss as ordinary: gin does it in 61.6 ns with nothing on the heap, chi in 298.8 ns, echo in 435.1 ns. Only the standard library turns failure into the most expensive thing it does.
I have not found a published router benchmark that measures this. The canonical
suite everyone forks states its own toolchain as go1.3rc1 and describes
http.ServeMux as “limited to static routes and does not support parameters” —
a router Go 1.22 replaced. Gin’s own benchmarks were refreshed in March 2026 on
the same class of machine as this one, and they measure matching only.
What the mux is doing
An allocation profile names it immediately:
$ go test -run=^$ -bench='Dispatch/router=stdlib/path=miss' -benchmem \
    -memprofile=/tmp/stdlib-miss.prof -memprofilerate=1 ./routers
$ go tool pprof -top -nodecount=6 -sample_index=alloc_objects /tmp/stdlib-miss.prof
File: routers.test
Type: alloc_objects
Showing nodes accounting for 1633871, 97.54% of 1675075 total
Dropped 254 nodes (cum <= 8375)
Showing top 6 nodes out of 23
      flat  flat%   sum%        cum   cum%
   1458324 87.06% 87.06%    1458324 87.06%  net/http.(*routingNode).matchPath
     54014  3.22% 90.28%      54014  3.22%  net/textproto.MIMEHeader.Set (inline)
     40514  2.42% 92.70%      40514  2.42%  slices.AppendSeq[go.shape.[]go.shape.string,go.shape.string] (inline)
     27007  1.61% 94.32%      81097  4.84%  net/http.Error
     27006  1.61% 95.93%     459102 27.41%  net/http.(*ServeMux).matchOrRedirect
     27006  1.61% 97.54%    1120754 66.91%  net/http.(*ServeMux).matchingMethods
Two thirds of the allocations are in matchingMethods, which is not the lookup.
The lookup is matchOrRedirect, and it is the 27%.
The mux does not stop when nothing matches. It wants to answer 405 Method Not Allowed rather than 404 when the path exists under a different method, so it
goes back and asks which methods would have matched
(server.go):
// Not Found and Method Not Allowed, see if there is another pattern that
// matches except for the method.
allowedMethods := mux.matchingMethods(host, path)
if len(allowedMethods) > 0 {
	return HandlerFunc(func(w ResponseWriter, r *Request) {
		w.Header().Set("Allow", strings.Join(allowedMethods, ", "))
		Error(w, StatusText(StatusMethodNotAllowed), StatusMethodNotAllowed)
	}), "", nil, nil
}
return NotFoundHandler(), "", nil, nil
matchingMethods walks the tree, and then walks it again with a trailing slash
appended, because matchOrRedirect would have tried that too. The walk itself
is per method
(routing_tree.go):
n.children.eachPair(func(method string, c *routingNode) bool { ... c.matchPath(path, nil) ... }).
One full path match per registered method, twice over.
That is the 87% sitting in matchPath.
Which axis it moves along
If the cost is a per-method walk, then it should track methods and not routes. Both sweeps are in the harness, and they agree.
Ten times the table, methods held at four:
routes │    stdlib      │     gin
   020   1522.00n ± 1%    50.35n ± 1%
   050   1642.00n ± 6%    50.01n ± 1%
   100   1684.00n ± 1%    50.48n ± 1%
   200   1904.00n ± 1%    62.18n ± 0%
The same paths, varying only how many distinct methods are registered:
methods │    stdlib     │ stdlib allocs │    gin
      1   1215.00n ± 2%       40.00 ± 0%   61.92n ± 0%
      2   1570.00n ± 3%       50.00 ± 0%   61.87n ± 0%
      3   1721.00n ± 2%       56.00 ± 0%   61.68n ± 0%
      4   1894.50n ± 1%       62.00 ± 0%   61.45n ± 0%
A ten-fold table costs 25% more. Four methods instead of one costs 56% more and
22 more allocations across three added methods, which is the eachPair loop
showing up as arithmetic. gin does not move on either axis.
Note the floor: even with a single method registered, a miss is 1215 ns and 40 allocations. Most of the cost is not the sweep; it is the second pass existing at all.
What to measure instead
The ranking these benchmarks produce is real and almost never actionable. The two numbers that are:
Your dispatch against your own encoding. A router that is three times faster
than another is three times faster at a tenth of what serialising the answer
costs. Put one json.Marshal of your actual response body in the same table and
read the ratio.
Your miss path. If net/http is your router and 404s are a meaningful share
of your traffic — a scanner sweeping paths, a stale client, a health check
pointed at the wrong URL — that share costs 25 times what your served requests
cost to route, and it allocates where nothing else does.
What this does not measure
The handler is empty, which is the point, and it also means none of this
describes a request. Middleware is absent for the same reason: chi.NewRouter()
with a real stack and gin.Default() with its logger are different measurements,
and in a real service they are almost certainly the larger ones.
Fiber is missing because it is built on fasthttp and does not implement
http.Handler, so putting it on this bench would change what the bench is.
The request is built once and reused. Every router here either leaves it untouched or replaces the fields it needs per call, so reuse costs nothing a fresh request would not — but a server allocates a new one per connection read, and that cost is outside this table.
And the miss path measured is a path that matches nothing at all. The other
miss — a path that exists under a different method, where matchingMethods
finds something and the mux answers 405 — will do the same walk and then
allocate an Allow header on top of it. I have not measured that one.
Frequently asked
Is net/http's ServeMux slower than gin or chi?
For matching, by a margin that almost never matters: 85.6 ns against gin's 23.6 ns on a static route, when a single json.Marshal of the response body costs 237.1 ns. For failing to match, by a margin that can: 2125.5 ns and 62 allocations against gin's 61.6 ns and zero. If your service answers a meaningful number of requests with 404, that is the row to look at.
Why does a 404 allocate at all?
Because the mux does not stop at "no handler". Before answering 404 it calls matchingMethods, which walks the routing tree once for every method registered under that node — and then walks it a second time with a trailing slash appended — collecting the set of methods that would have matched, so it can answer 405 Method Not Allowed instead when one exists. An allocation profile puts 87% of the allocations in routingNode.matchPath, reached from that pass.
Does adding routes make the miss slower?
Barely. Going from 20 routes to 200 — ten times the table — moved the miss from 1522 ns to 1904 ns, about 25%. Going from one registered method to four, with the paths unchanged, moved it from 1215 ns to 1894.5 ns and from 40 allocations to 62. The number of distinct methods is the axis; the number of routes mostly is not.
Should I switch routers because of this?
Nothing here is a reason to. The gap on a matching request is a fraction of one JSON encode, and middleware, binding and error handling — the reasons people actually choose gin or chi — are not measured at all. The useful action is smaller: measure your own dispatch next to your own response encoding, and measure a path that matches nothing.