Category: Concurrency in practice
The mutex was 68 times faster, until I added work
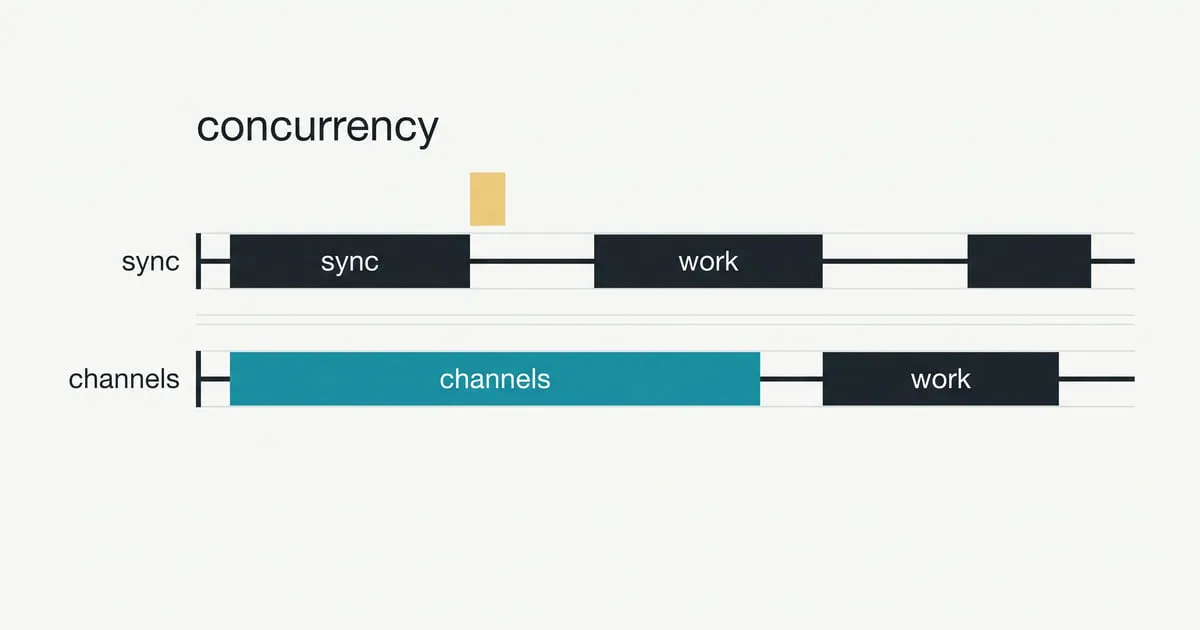
One goroutine: 2.5 ns for the mutex, 172.6 ns for the channel. Sixteen goroutines with real work: the channel wins by less than the harness's own error.
TL;DR
- At one goroutine, incrementing a counter cost 2.5 ns behind a `sync.Mutex`, 88.9 ns through an unbuffered channel and 172.6 ns through a channel that acknowledges — factors of 35 and 68.
- With an empty critical section there is no crossover at any contention level from 1 to 64 goroutines. The mutex wins every row.
- With 146 ns of work inside the critical section the curves meet at eight goroutines and stay met. At sixteen the acknowledging channel came back 1.37% faster at p=0.000.
- In the same table a second copy of the mutex, compared against itself, came back 2.99% faster at p=0.000. The channel's win is smaller than the harness's own error.
- The mutex's cost is not monotonic in contention. It peaks at 108.9 ns with eight goroutines, then falls back and stays between 92 and 97 ns from 16 to 64.
Incrementing a counter cost 2.5 ns behind a sync.Mutex and 172.6 ns through a
channel. Then I put 146 ns of work inside the critical section, and at sixteen
goroutines the channel came back 1.37% faster at p=0.000. In the same run, a
second copy of the mutex came back 2.99% faster than itself.
“Don’t communicate by sharing memory, share memory by communicating” is a design proverb — Rob Pike’s, from the Go Proverbs talk at Gopherfest SV 2015 — and its second half gets quoted as a performance claim. This post draws the curve the claim implies — one counter, five ways of guarding it, from one goroutine to sixty-four — and then checks whether the place the curves cross is a contention level or a rounding error.
What is being measured
All numbers: go1.27.0 darwin/arm64, Apple M4 Pro, 12 cores, macOS 26.6.2.
Benchmarks with -benchmem -count=10, summarised by benchstat. The harness is
mutexchan/.
Five implementations of one counter, behind an interface that hands each goroutine its own closure — so per-goroutine state, such as a reply channel, is paid for once per goroutine and not once per operation:
type Counter interface {
	Handle() func()
	Close() int64
}
mutex takes a sync.Mutex. atomic is a single atomic.Int64 add, which has
no critical section at all and is here as a floor. chan-unbuf and
chan-buf1024 send to an owner goroutine and do not wait. chan-ack sends and
waits for the acknowledgement, which is the only channel shape that offers what
a Lock/Unlock pair offers: the increment has happened when the call returns.
Close drains the channel and compares the total against b.N, so an
asynchronous implementation cannot look fast by leaving work undone.
The curve with an empty critical section
$ go test -run=^$ -bench='Warmup|Counter' -benchmem -count=10 ./mutexchan |
    grep -v Warmup | benchstat -row /goroutines -col /impl -
│ mutex │ mutex-control │ atomic │ chan-unbuf │ chan-buf1024 │ chan-ack │
│ sec/op │ sec/op │ sec/op │ sec/op │ sec/op │ sec/op │
1 2.549n ± 1% 2.540n ± 2% 1.828n ± 0% 88.910n ± 1% 24.480n ± 3% 172.600n ± 5%
2 19.375n ± 5% 20.090n ± 14% 6.269n ± 9% 124.300n ± 2% 28.985n ± 2% 175.400n ± 4%
4 68.730n ± 1% 73.640n ± 14% 14.750n ± 3% 201.450n ± 5% 38.000n ± 11% 171.450n ± 2%
8 108.850n ± 2% 108.000n ± 0% 23.720n ± 22% 271.300n ± 5% 51.370n ± 1% 173.400n ± 2%
16 94.400n ± 0% 93.880n ± 3% 43.810n ± 4% 305.550n ± 3% 69.460n ± 9% 176.450n ± 1%
32 96.590n ± 0% 96.360n ± 1% 43.330n ± 5% 404.300n ± 3% 110.450n ± 1% 175.250n ± 2%
64 91.510n ± 1% 91.270n ± 2% 41.350n ± 36% 502.400n ± 4% 188.300n ± 5% 183.700n ± 2%
geomean 43.780n 44.310n 16.370n 233.200n 57.190n 175.400nEvery row reported 0 B/op and 0 allocs/op, so the rest of this post is about
time.
The second column is not a fifth implementation. mutex-control is another
mutex — same type, same code, registered as its own row and measured in the
same run — so its true difference from mutex is zero by construction, and
whatever benchstat prints for it is this session’s error bar. That is the
method from
benchstat or it didn’t happen, and it is
the only reason any percentage below means anything.
There is no crossover. The mutex wins every level from one goroutine to sixty-four; the unbuffered channel starts 35 times behind and ends 5.5 times behind, the acknowledging one starts 68 times behind and ends twice behind. The gap narrows and never closes.
The curve with 146 ns in it
An empty critical section is not the case anybody has. BenchmarkSpin prices
128 xorshift iterations at 145.9 ns; that goes inside the lock, and inside the
owner goroutine’s loop, so both designs serialise the same work:
$ go test -run=^$ -bench='Warmup|Counter' -benchmem -count=10 ./mutexchan \
    -spin=128 | grep -v Warmup | benchstat -row /goroutines -col /impl -
│ mutex │ mutex-control │ chan-unbuf │ chan-buf1024 │ chan-ack │
│ sec/op │ sec/op │ sec/op vs base │ sec/op vs base │ sec/op vs base │
1 147.4n ± 0% 147.5n ± 0% 358.2n ± 3% +143.05% (p=0.000) 209.6n ± 5% +42.20% (p=0.000) 404.1n ± 8% +174.15% (p=0.000)
2 230.7n ± 1% 236.3n ± 2% 304.5n ± 2% +32.02% (p=0.000) 305.4n ± 8% +32.43% (p=0.000) 357.0n ± 4% +54.78% (p=0.000)
4 266.1n ± 1% 265.3n ± 2% 445.2n ± 7% +67.27% (p=0.000) 340.6n ± 4% +27.95% (p=0.000) 339.1n ± 1% +27.39% (p=0.000)
8 322.6n ± 1% 321.9n ± 1% 415.2n ± 2% +28.72% (p=0.000) 359.6n ± 10% +11.47% (p=0.000) 327.1n ± 1% +1.40% (p=0.000)
16 332.1n ± 1% 331.7n ± 2% 471.9n ± 2% +42.06% (p=0.000) 419.1n ± 4% +26.18% (p=0.000) 327.6n ± 1% -1.37% (p=0.000)
32 332.6n ± 0% 322.7n ± 2% 516.1n ± 7% +55.16% (p=0.000) 497.9n ± 15% +49.69% (p=0.000) 328.2n ± 1% -1.32% (p=0.001)
64 331.8n ± 0% 318.9n ± 4% 508.6n ± 3% +53.32% (p=0.000) 566.2n ± 9% +70.66% (p=0.000) 333.9n ± 8% ~ (p=0.160)Here is the crossover the proverb implies. At one goroutine the acknowledging
channel is still 174% behind. By eight it is 1.40% behind, by sixteen it is
1.37% ahead at p=0.000, and it stays ahead at thirty-two.
A 1.37% win at p=0.000 is the kind of number a pull request gets approved on.
So I read the column next to it.
The copy of the mutex that beat the mutex
mutex-control runs the same code as mutex. Its true delta is zero. At
thirty-two goroutines benchstat reported it 2.99% faster at p=0.000, and
at sixty-four 3.87% faster at p=0.001.
Both of those are larger than every win the channel produced. The channel’s 1.37% at sixteen goroutines is less than half of what a literal copy of the baseline managed against itself in the same run, at a comparable p-value. The p-value is not lying: those two sets of samples really did come from different distributions. They came from different distributions because they ran in different positions, on different cores, at different points in the process’s life — and none of that is the code.
The honest reading of the busy table is therefore not “the channel wins past sixteen goroutines”. It is that past eight goroutines this benchmark can no longer tell the two apart, and it says so with a number: about 3%. That number is specific to this machine and this session, which is exactly why it is measured rather than assumed — on a quieter machine a real 1.37% might survive.
Why the channel’s line is flat
The acknowledging channel cost 172.6 ns at one goroutine and 183.7 ns at sixty-four — a 6% rise across a sixty-four-fold change in contention. Nothing else in the table behaves like that.
One goroutine owns the counter and applies every increment, so throughput is bounded by the handoff rather than by the senders. A second sender does not make the receive faster or slower; it only waits longer for its turn, and the benchmark divides that waiting back out again.
The handoff is a park and an unpark: the sender blocks, the runtime takes its goroutine off the P and runs something else, and the owner’s receive makes it runnable again — the same mechanism that lets a blocked goroutine cost nothing when the runtime owns the thing it is blocked on.
The buffered channel is the exception that confirms it. chan-buf1024 is cheap
while the buffer absorbs the senders — 24.5 ns at one goroutine — and degrades
steadily as they outrun the owner, reaching 188.3 ns at sixty-four. That is
within 3% of what the acknowledging channel cost at every level, which is the
handoff price arriving late rather than being avoided. A buffer does not remove
the handoff; it defers it until the buffer is full.
Why the mutex gets faster after eight goroutines
The mutex column is not monotonic, and this surprised me. It climbs from 2.5 ns to 108.9 ns at eight goroutines, then falls to 94.4 ns at sixteen and stays between 92 and 97 ns through sixty-four.
sync.Mutex has two modes. In normal mode an arriving goroutine spins briefly
and may take the lock ahead of goroutines already queued — fast when contention
is low, unfair when it is high. When a waiter has been queued for more than a
millisecond the mutex switches to starvation mode and hands the lock directly to
the head of the queue, which removes both the spinning and the barging. The
threshold is the constant starvationThresholdNs = 1e6 in
src/internal/sync/mutex.go,
where sync.Mutex has forwarded its implementation since Go 1.24.
Whether that is what happened here is a separate question, and the sweep cannot
answer it: the mode is not observable from outside the runtime. So fairness/
measures its two symptoms — how evenly the lock was distributed, and how long
the longest waiter waited.
$ go build -o /tmp/fairness ./mutexchan/fairness
$ /tmp/fairness -dur=3s
n          min ops    median ops       max ops   max/min
2         51271680      60759040      60759040      1.19
4         10675200      10770432      10778624      1.01
8          3389440       3465216       3486720      1.03
16         1918976       2013184       2026496      1.06
32          890880        928768        949248      1.07
64          487424        512000        540672      1.11

$ /tmp/fairness -dur=3s -timed
n         max wait      p99 wait        median   reached 1ms
2         15.939ms            0s          83ns   true
4          1.878ms           6µs         250ns   true
8          1.568ms          30µs         250ns   true
16           1.7ms          63µs         125ns   true
32         2.937ms         149µs         166ns   true
64         3.546ms         338µs         125ns   true
Both symptoms are there. The longest wait crosses one millisecond at every
level, so the threshold is reached. And the distribution is close to flat — above
two goroutines, no goroutine got more than 11% more turns than the slowest —
which is what a FIFO handoff looks like and not what barging looks like. The
timed run’s two time.Now calls per Lock inflate the waits, which makes the
crossing a weaker claim rather than a stronger one; the distribution run has no
timing in it at all.
The tail also shows this is not a permanent state. The median wait is under 250 ns and the p99 is microseconds; only the extreme tail reaches a millisecond, and the mutex returns to normal mode as soon as a waiter is served quickly. The plateau at 92–97 ns is a lock flipping between two modes, not sitting in one.
Eight goroutines on twelve cores is where the spinning stops paying and the flipping has not yet settled. It is the worst of both, and it is the peak of the curve.
Where the boundary actually is
“At what contention level does a channel beat a mutex” has no answer on this machine, and not because the answer is very large. The boundary is not a goroutine count at all. It is a comparison between two numbers you have to measure yourself: the size of the win, against the size of the win a copy of your baseline reports. If the first is smaller, the benchmark has not distinguished the implementations, whatever the p-value says — and adding the copy costs one more entry in the table and no extra command.
What this does not measure
A counter is the smallest possible critical section, and the two work levels here — nothing, and 146 ns — are both far below what a real one does. A section holding a map write or an I/O call moves both curves, and may move them differently.
There are also no other goroutines in it. A service under load has hundreds of
runnable goroutines competing for the same Ps, and a design with a single owner
is a different proposition when that owner has to wait its turn to run. It says
nothing about sync.RWMutex, sharding or per-P accumulation either, all of
which remove the contention instead of serialising it — which is the actual
answer when the contention is the problem.
And fairness/ measures the symptoms of starvation mode, not the mode. An even
distribution and a millisecond wait are what that mode produces, but not the
only things that could produce them. Reading the flag needs the runtime’s own
instrumentation, and that is a different experiment.
Frequently asked
Is a channel slower than a mutex in Go?
For guarding a shared value, yes, and by a wide margin when there is nothing inside the critical section: 2.5 ns against 172.6 ns at one goroutine on the machine below. The margin narrows as contention rises and as the critical section does real work, and at eight goroutines with 146 ns of work in it the two are no longer separable. Neither result says anything about the cases channels exist for — moving work between goroutines, cancellation, fan-out — which this benchmark does not measure.
At what contention level do channels become faster than mutexes?
On this machine, none that can be defended. With an empty critical section the mutex won every row from 1 to 64 goroutines. With work inside it, the acknowledging channel came back 1.37% faster at 16 goroutines with p=0.000 — but a second copy of the mutex, measured against itself in the same run, came back 2.99% faster with p=0.000. A win smaller than the control pair is a property of the harness, not of the code.
Why does the channel-owned counter cost the same at 1 goroutine as at 64?
Because one owner goroutine applies every increment, so throughput is bounded by the handoff rather than by the senders. Adding senders does not make the handoff slower; it makes each sender wait longer, and the benchmark divides that wait back out again. The measured range across a 64-fold change in contention was 172.6 ns to 183.7 ns.
Should I replace a mutex with a channel for performance?
Not on the strength of a number smaller than your own control pair. Put a second copy of the baseline in the same benchmark table, read the win against what that copy reports, and if the win is smaller, the measurement cannot tell the two apart. The reasons to choose a channel are ownership and composition, and those are not settled by nanoseconds.