Category: Performance and measurement
Escape analysis is not a rule of thumb
The compiler said "does not escape" and the benchmark reported 104 KiB per operation. Both were right. What -gcflags=-m actually tells you.
TL;DR
- -m reports escape analysis, not allocation. The same make([]byte, n) was marked "does not escape" and still allocated 104 KiB per operation.
- Taking the address of a local does not move it to the heap. A function that takes a pointer, uses it and drops it costs 0.23ns and zero allocations.
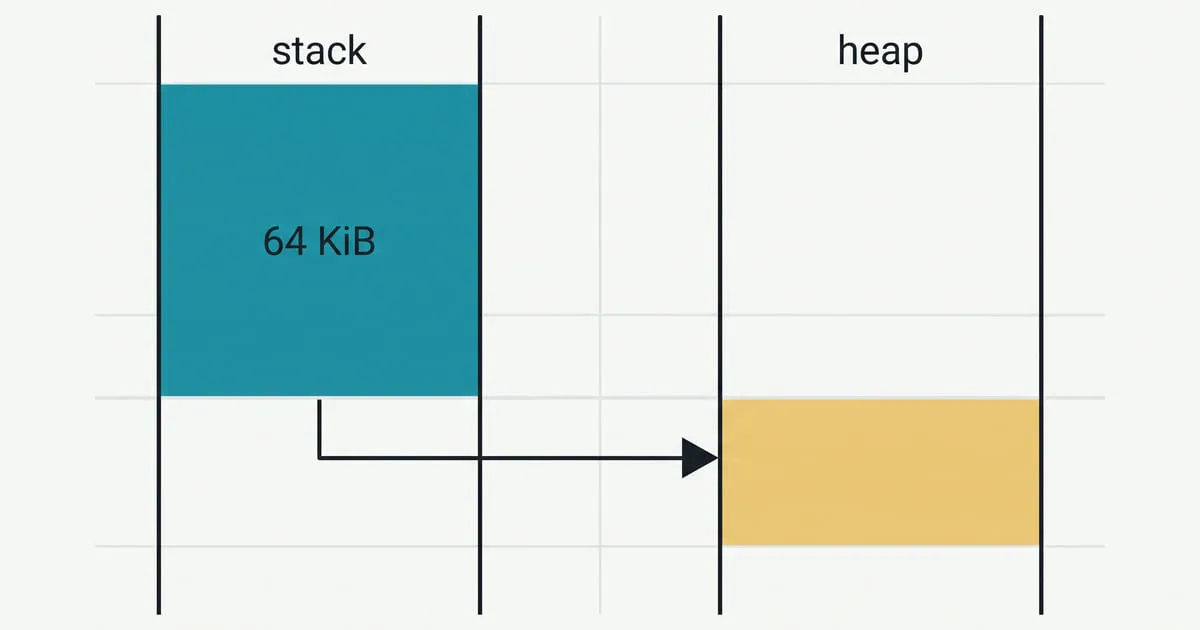
- The stack limit for a single constant-sized `make` is 64 KiB. 65,536 bytes stayed on the stack; 65,537 escaped. A variable you declare yourself gets a separate limit, and it is 128 KiB.
- Stack allocation is not free. A 64 KiB stack buffer cost 1.14µs per call — 248 times what the 16-byte heap allocation in the same table cost.
“Don’t return pointers, it causes heap allocation.” “Passing by value avoids the
GC.” Every Go codebase has a comment like this, and the reasoning behind it is
almost always a memory of reading go build -gcflags=-m output once.
The output is real. The rule of thumb built on it usually is not. Here is a single file, its actual escape analysis, and the benchmark that contradicts the obvious reading of it.
All numbers: go1.27.0 darwin/arm64, Apple M4 Pro, 12 cores, macOS 26.6.2.
Benchmarks with -benchmem -count=10, summarised by benchstat — and read
against a control pair, for the reason
a benchstat delta is not evidence on its own.
The file is
escape/.
The subject
Ten small functions covering the cases people actually argue about. Six of them:
type Point struct{ X, Y int }

// 1. The textbook case: the pointer outlives the frame.
func NewPoint(x, y int) *Point {
	p := Point{x, y}
	return &p
}

// 2. The address is taken, but never leaves.
func Sum(x, y int) int {
	p := Point{x, y}
	q := &p
	return q.X + q.Y
}

// 4. Same allocation, one size known at compile time and one not.
func FixedBuffer() byte  { buf := make([]byte, 1024); return buf[0] }
func VarBuffer(n int) byte { buf := make([]byte, n); return buf[0] }

// 5. Both sizes constant. Only one of them fits.
func SmallFixed() byte { buf := make([]byte, 65536); return buf[0] }
func LargeFixed() byte { buf := make([]byte, 65537); return buf[0] }
-l disables inlining, which is what you want while reading escape output:
inlining rewrites the program, and you are trying to read the verdict for the
function you wrote.
$ go build -gcflags='-m -l' ./escape
# gopheria.lab/escape
escape/escape.go:9:2: moved to heap: p
escape/escape.go:22:20: discard{} escapes to heap
escape/escape.go:22:12: ... argument does not escape
escape/escape.go:22:24: x escapes to heap
escape/escape.go:27:22: b does not escape
escape/escape.go:31:13: make([]byte, 1024) does not escape
escape/escape.go:36:13: make([]byte, n) does not escape
escape/escape.go:42:13: make([]byte, 65536) does not escape
escape/escape.go:47:13: make([]byte, 65537) escapes to heap
escape/escape.go:54:14: []*int{...} does not escape
escape/escape.go:64:7: func literal does not escape
escape/escape.go:68:21: leaking param: done
escape/escape.go:69:5: func literal escapes to heap
Read line 36. make([]byte, n), size unknown at compile time, does not
escape. Hold on to that.
What the benchmark says
                  │   sec/op   │    B/op    │ allocs/op │
NewPoint-12         4.587n ± 3%   16.00 ± 0%   1.000 ± 0%
Sum-12             0.2303n ± 1%   0.000 ± 0%   0.000 ± 0%
FixedBuffer-12      10.19n ± 0%   0.000 ± 0%   0.000 ± 0%
VarBufferSmall-12   10.19n ± 0%   0.000 ± 0%   0.000 ± 0%
VarBufferLarge-12   4.134µ ±21%  104.0Ki ± 0%  1.000 ± 0%
SmallFixed-12       1.138µ ± 5%   0.000 ± 0%   0.000 ± 0%
LargeFixed-12       3.446µ ±20%  72.00Ki ± 0%  1.000 ± 0%
SumAll-12           1.407n ± 0%   0.000 ± 0%   0.000 ± 0%
VarBufferSmall and VarBufferLarge are the same function, the one the
compiler said does not escape. Called with 1024 it allocates nothing. Called
with 100,000 it allocates 104 KiB and one object, every single time.
Why both are correct
Escape analysis answers one question: does this value outlive the frame that
created it? For make([]byte, n) the answer is no, and -m reports it
honestly.
Whether the frame can hold the value is a different question, and for a
variable size the compiler cannot answer it at compile time. So it emits both
paths: a stack allocation when n is small enough, and a call into
runtime.makeslice when it is not. The branch is taken at runtime, per call.
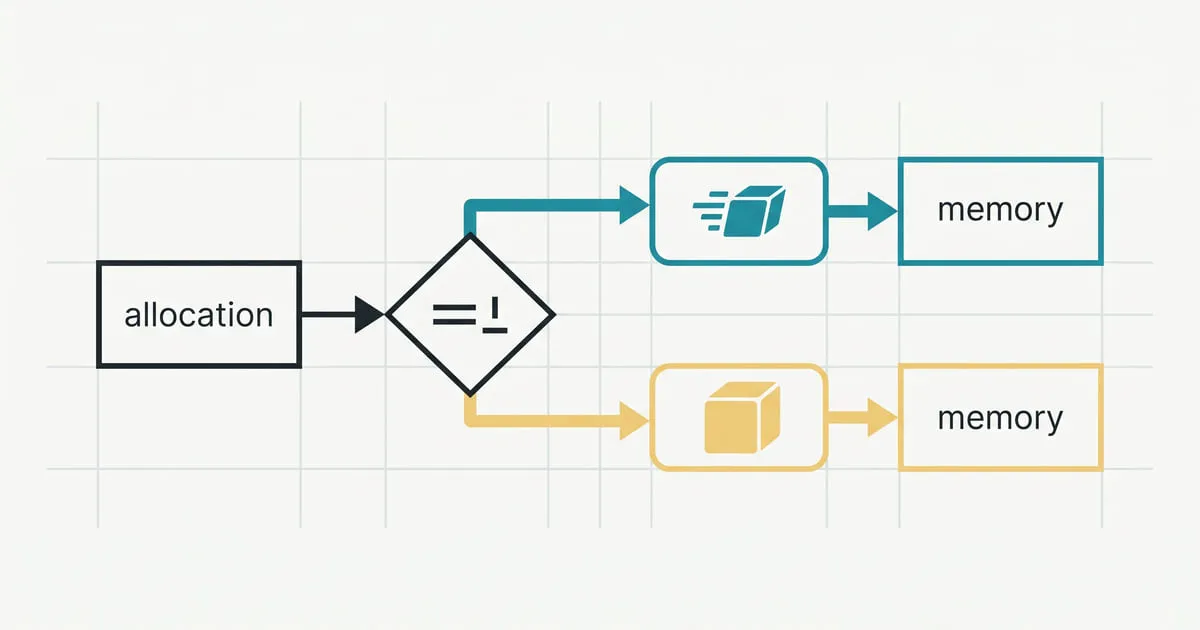
That is the whole misunderstanding in one line of output. -m is not an
allocation report. It tells you what the compiler proved about lifetime. What
actually lands on the heap depends on lifetime and size and, once inlining
is back on, the call site.
The threshold for a single implicitly allocated object — what make, new
and a composite literal produce — is 64 KiB, and the two Fixed functions sit
either side of it: 65,536 bytes stayed on the stack, 65,537 went to the heap.
One byte. A variable you declare yourself is held to a different limit:
var buf [128 * 1024]byte stays on the stack and one byte more does not.
Taking an address is not the expensive part
Sum takes the address of a local, dereferences it twice, and costs 0.23
nanoseconds with zero allocations — this is the compiler keeping the whole
thing in registers.
SumAll builds a three-element slice of pointers to three locals and still
allocates nothing. Indirection is not the trigger. Escape is the trigger, and
escape means outliving the frame.
The rule “don’t take addresses of locals” costs you readable code and buys nothing. The rule that survives contact with the data is narrower: do not return pointers to values the caller does not need to keep, and be aware that passing a value to something that stores it — an interface, a channel, a goroutine, a global — is what actually moves it.
The interface case is worth seeing, because nothing in the source looks like it escapes:
escape/escape.go:22:24: x escapes to heapx is an int passed to a variadic ...any. Boxing it into an interface means
taking its address, and the callee’s signature says nothing about whether it
keeps the pointer, so the compiler must assume the worst. This is why logging an
integer in a hot path allocates and a strconv.AppendInt into a reused buffer
does not.
The closure case is the same rule wearing a costume
Two function literals, two different verdicts:
escape/escape.go:64:7: func literal does not escape
escape/escape.go:69:5: func literal escapes to heap
The first is called immediately and discarded. The second is handed to go.
Nothing about the closures differs — the capture is the same variable, the body
is the same expression. What differs is that a goroutine’s lifetime is unrelated
to the frame that started it, so the closure and everything it captures must
survive independently.
This is the rule that explains every case in the file, including the interface
one: the compiler is not asking whether you took an address, it is asking
whether it can prove the value dies here. Anything it cannot see the end of —
a goroutine, an interface method it cannot devirtualise, a channel send, a
global — is an escape. That is also why a goroutine capturing a large struct
costs more than the go statement suggests, and why the fix is passing the
handful of fields it uses rather than the struct. Whether the goroutine then
costs you an OS thread is a separate
question with its own surprising answer.
Stack allocation is not free either
SmallFixed allocates nothing and takes 1.14µs. NewPoint allocates 16
bytes on the heap and takes 4.6 nanoseconds.
Zeroing 64 KiB of stack per call costs more than a small heap allocation, by two
orders of magnitude. “Zero allocs” is a good signal and a bad target: a
benchmark reporting 0 allocs/op while burning a microsecond per call has
optimised the metric rather than the program.
What this does not cover
Everything above was compiled with inlining disabled. That is correct for
reading -m and wrong for predicting production, where inlining routinely
changes the answer — a constructor that escapes on its own can stop escaping
once it is inlined into a caller that drops the result. The honest workflow is:
read -m -l to understand the function, then benchmark the real build to find
out what happens.
Both size limits are implementation details of the current gc compiler, not language guarantees. They have moved before and can move again.
And this measures allocation, not cost. An allocation that survives into the old
generation costs the collector far more than one that dies immediately, and
allocs/op cannot tell them apart. That needs a heap profile, which is a
different article.
Frequently asked
Does "does not escape" mean the value is stack-allocated?
No. It means the value does not outlive its frame. Whether the frame can hold it is a separate question the compiler answers at runtime for variable-sized objects, and a 100,000-byte slice goes to the heap regardless of what -m printed about it.
Why disable inlining with -l when reading escape output?
Inlining changes escape analysis, so with inlining on you are reading the verdict for a program that no longer matches your source. -l gives you the per-function answer. Then remove it and benchmark, because the inlined program is the one that ships.
Is returning a pointer always an allocation?
Yes when the pointer genuinely outlives the frame, as in a constructor. No when the caller is inlined into a context where the compiler can prove the value dies with the frame. -m is per-function; allocation is per-call-site.