Category: Runtime internalsSeries · part 1 of 4
What the Go scheduler does when your goroutine blocks
A blocking syscall costs an OS thread. A blocking network read costs nothing. Measured with 200 goroutines, GOMAXPROCS=2 and a thread count.
TL;DR
- Two hundred goroutines blocked in a raw read(2) produced 203 OS threads. The same two hundred blocked on a TCP read produced four.
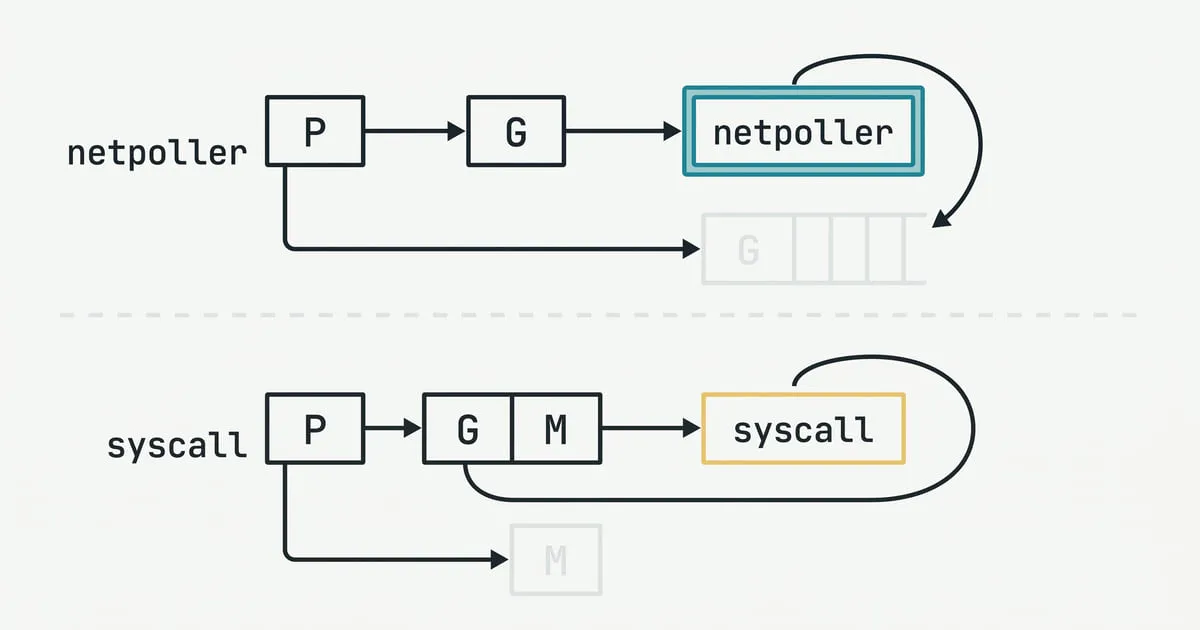
- The difference is the netpoller — a file descriptor it owns parks the goroutine, while a syscall it does not know about parks the whole thread.
- Both Ps sat idle in both cases. Idle Ps and 200 live threads is not a contradiction; it is exactly what a handoff looks like from outside.
- Fast syscalls do not trigger a handoff at all — sysmon only retakes a P whose syscall outlasted a sysmon tick, at least 20µs, and 200 goroutines hammering write(2) added one thread.
Ask what happens when a goroutine blocks and you usually get an answer about goroutines being cheap. That answer is true and it is not the interesting part. The interesting part is what happens to the thread the goroutine was running on, because that is the resource you can actually run out of.
The runtime’s answer depends entirely on how the goroutine blocked, and the gap between the two cases is much larger than most people expect.
The three vocabulary words
The scheduler is usually drawn as G, M and P, and the letters matter here:
- G — a goroutine. Cheap, a few kilobytes, thousands are fine.
- M — a machine, meaning an OS thread. Expensive: a kernel stack, a scheduling entity, real memory.
- P — a processor, meaning permission to run Go code. There are
GOMAXPROCSof them and no more.
An M needs a P to execute Go code. That is the whole design: goroutines are unlimited, threads are not, and the P is the token that rations the middle.
When a goroutine blocks, the question the runtime has to answer is whether the P can be taken away from it and given to someone else.
The measurement
Two hundred goroutines, each blocked in a different way, GOMAXPROCS=2, and a
count of the OS threads the process created. Thread count comes from the
runtime’s own threadcreate profile, so there is nothing to interpret:
func osThreads() int { return pprof.Lookup("threadcreate").Count() }Case one parks each goroutine in read(2) on the read end of a raw pipe nobody
writes to. The descriptors come from syscall.Pipe, not os.Pipe, which
matters: raw file descriptors never reach the netpoller, so the syscall really
does block.
func blockInSyscall() {
	for i := 0; i < blockers; i++ {
		var fds [2]int
		if err := syscall.Pipe(fds[:]); err != nil {
			panic(err)
		}
		go func(fd int) {
			buf := make([]byte, 1)
			syscall.Read(fd, buf)
		}(fds[0])
	}
}
Case two parks each goroutine in a read on an idle TCP connection — same “waiting for bytes that never come”, different plumbing.
$ GOMAXPROCS=2 ./threads syscall
GOMAXPROCS=2
threads before: 4
goroutines blocked: 200
threads after:  203

$ GOMAXPROCS=2 ./threads netpoll
GOMAXPROCS=2
threads before: 4
goroutines blocked: 200
threads after:  4
Two hundred and three threads against four. Same number of blocked goroutines, same amount of nothing happening, a fifty-fold difference in what it costs.
What the scheduler saw
GODEBUG=schedtrace=1000 prints the scheduler’s own view once a second, and it
explains the number:
$ GOMAXPROCS=2 GODEBUG=schedtrace=1000 ./threads syscall
SCHED 1006ms: gomaxprocs=2 idleprocs=2 threads=202 spinningthreads=0 needspinning=0 idlethreads=0 runqueue=0 [ 0 0 ] schedticks=[ 98 108 ]

$ GOMAXPROCS=2 GODEBUG=schedtrace=1000 ./threads netpoll
SCHED 1008ms: gomaxprocs=2 idleprocs=2 threads=4 spinningthreads=0 needspinning=0 idlethreads=2 runqueue=0 [ 0 0 ] schedticks=[ 300 305 ]
Look at idleprocs=2 in the first line. Both Ps are idle while 202 threads
exist. That looks like a contradiction and it is the whole mechanism.
When a goroutine enters a syscall, the runtime marks its P as _Psyscall and
lets the thread go. If the syscall returns quickly the thread reacquires its own
P and nothing happened. If it does not, the monitor thread — sysmon, which
runs outside the scheduler precisely so it can watch it — notices a P that has
been sitting in _Psyscall too long and retakes it: the P is detached from
the blocked thread and handed to another M, which is started if none is
available.
So the blocked thread keeps its goroutine and its kernel wait, and the P — the right to run Go code — moves on without it. The Ps are idle because there is no Go code to run. The threads exist because 200 of them are sitting in the kernel.
Why the network case is free
net.Conn never issues a blocking read. Sockets and pipes created through net
or os are registered with the netpoller, the runtime’s epoll/kqueue
integration. A read on an empty connection does not enter the kernel and wait;
it parks the goroutine on the netpoller and returns the thread to the scheduler
immediately. Regular files are the exception — kqueue and epoll cannot poll
them, so a read from disk blocks its thread exactly like the raw pipe above.
The goroutine is now the runtime’s problem rather than the kernel’s. When bytes arrive, the netpoller — polled by the scheduler when it goes looking for work, and by sysmon when nothing else does — moves the goroutine back onto a run queue. No thread was ever committed to the wait.
Four threads for two hundred idle connections is the reason a Go server holds tens of thousands of them without a thread-per-connection catastrophe.
Slow is what matters, not “syscall”
The handoff is not free — retaking a P and starting an M costs more than the syscall usually does. So sysmon does not do it eagerly. It only retakes a P whose syscall has outlasted a sysmon tick — at least 20µs, and longer once sysmon backs its polling interval off, which it doubles up to 10ms while the process has nothing to wake.
Two hundred goroutines in a tight loop of write(2) to /dev/null spend nearly
all their time inside syscalls, but each call returns in well under that
threshold:
$ GOMAXPROCS=2 ./threads fast
GOMAXPROCS=2
threads before: 4
goroutines blocked: 200
threads after:  5
One extra thread. The word “syscall” is not what costs you; duration is. A program making millions of fast syscalls behaves nothing like a program making two hundred slow ones.
What this means when it is your service
- A goroutine blocked on a channel, a mutex, a timer, or any socket I/O through
netcosts no thread. Blocking on those is not a resource decision. - A goroutine blocked in a cgo call, a
syscall.Syscallon a raw descriptor, or a read from a slow local disk costs a thread for the duration. Two hundred concurrent ones cost two hundred threads. - That is why an unbounded worker pool doing cgo or file I/O degrades in a way
an unbounded pool doing network I/O does not — and why the fix is a semaphore
around the blocking call rather than a lower
GOMAXPROCS. - The runtime’s own ceiling is
debug.SetMaxThreads, default 10,000, and it does not throttle. It crashes the process.
The number this post keeps holding at two is the one worth pulling on next.
GOMAXPROCS turns out to cap neither the thread count nor anything else you
would guess from the name, and since Go 1.25 it is not even the machine that
sets its default —
GOMAXPROCS is not your thread count
sweeps it against this same workload and then measures what a container’s CPU
quota does to it.
Worth noting that the goroutine itself is the cheap part of all this, but not
free: a closure a go statement captures anything into has to outlive the frame
that started it, which makes it a heap allocation. That is the subject of
escape analysis is not a rule of thumb,
where the compiler’s verdict on that closure is shown next to what it actually
costs.
The two hundred goroutines are cheap in another sense that has a limit. Each one still owns its stack while it waits, and that stack is not a fixed 2 KiB — a goroutine’s stack is replaced and copied into as it deepens, nine times over on the way to 1 MiB, at a cost no allocation profile reports.
What this does not measure
Thread count is not thread cost. These threads are parked in the kernel and consume no CPU; what they consume is memory, scheduler bookkeeping and file descriptors, none of which this experiment quantifies.
The numbers are also one machine’s — go1.27.0 darwin/arm64, Apple M4 Pro, 12
cores, macOS 26.6.2. The harness is
threads/. The 20µs retake threshold and the netpoller integration are
runtime constants rather than platform ones, so the shape should hold anywhere;
the exact thread counts will not.
And the raw pipe is a laboratory instrument, not a workload. It was chosen
because it is the shortest way to get a syscall the netpoller cannot see. If you
want to reproduce this against something real, a database/sql driver using cgo
is the closest production equivalent.
Frequently asked
Does a blocked goroutine always cost an OS thread?
No. Only a goroutine blocked in a syscall the runtime cannot park it on. Channel operations, mutex waits, timers and any I/O on a descriptor registered with the netpoller park the goroutine and leave the thread free for other work.
Should I lower GOMAXPROCS to limit OS threads?
No — those are different knobs. GOMAXPROCS caps how many goroutines run Go code simultaneously; it places no limit on threads blocked in syscalls. In the measurement below GOMAXPROCS was 2 while 203 threads existed. The runtime-wide thread ceiling is SetMaxThreads, which crashes the process when reached rather than throttling.
Why does reading a regular file behave like the syscall case?
Regular files are not pollable on most systems, so the runtime issues a genuinely blocking read rather than registering the descriptor with the netpoller. A goroutine reading a slow disk holds its thread the same way the raw pipe below does.