Category: Runtime internalsSeries · part 3 of 4
GOMAXPROCS is not your thread count
GOMAXPROCS=1 with 200 goroutines blocked in read(2) produced 202 OS threads. Measured on go1.27.0, alongside the container case Go 1.25 changed.
TL;DR
- Two hundred goroutines blocked in a raw read(2) produced 202 OS threads at GOMAXPROCS=1 and 203 at GOMAXPROCS=12. The line is flat.
- A P is permission to execute Go code. A thread parked in a syscall is not executing Go code, holds no P, and is not counted by GOMAXPROCS.
- Since Go 1.25 the default reads the cgroup CPU quota rather than the machine — a 2-CPU quota on a 12-core host gives GOMAXPROCS=2, not 12.
- Restoring the old behaviour with GODEBUG=containermaxprocs=0 cost 52% of throughput and moved p99 from 101µs to 7.9ms across 20 runs.
- The floor is 2 and the rounding is upward — --cpus=0.5 still yields 2, and --cpus=2.5 yields 3.
I set GOMAXPROCS=1 and the process created 202 OS threads. Raising it to
twelve produced 203. GOMAXPROCS caps how many threads may run Go code at
once; it says nothing about how many exist — and on Linux, since Go 1.25, it is
not even the machine that sets its default.
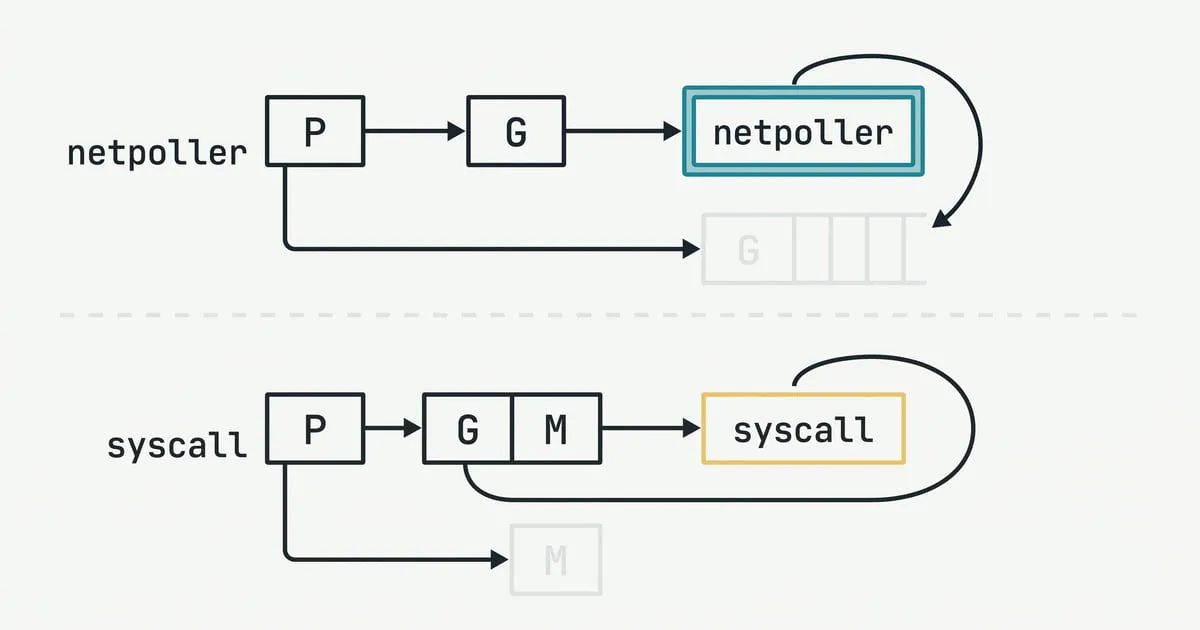
The scheduler post showed the first
half of that: two hundred goroutines parked in read(2), 203 OS threads alive,
and both Ps idle. It left the obvious question hanging. If two Ps and two
hundred threads can coexist, what is GOMAXPROCS a budget for — and if it is
not the thread count, which number is worth setting?
The measurement
Everything below is go1.27.0 darwin/arm64 on an Apple M4 Pro, 12 cores,
macOS 26.6.2, except the container runs, which use the same source
cross-compiled for linux/arm64 and run under Docker Desktop 4.88.1 (engine
29.7.2) on that same machine. The harness is in the
experiments repository.
Two hundred goroutines each block in read(2) on the read end of a raw pipe
nobody writes to. syscall.Pipe descriptors never reach the netpoller, so each
call blocks the thread it runs on and the runtime must find another thread for
the P. Thread count comes from the runtime’s own threadcreate profile:
func osThreads() int { return pprof.Lookup("threadcreate").Count() }Sweeping GOMAXPROCS across that fixed workload:
go build -o /tmp/gmp ./gomaxprocs
for p in 1 2 4 12; do GOMAXPROCS=$p /tmp/gmp threads 200; done
1 200 3 202
2 200 4 203
4 200 5 203
12 200 5 203The columns are GOMAXPROCS, blocked goroutines, threads before, threads after.
A twelvefold change in GOMAXPROCS moved the thread count by one.
Why the two counts diverge
Twelve Ps did not produce twelve threads, and one P did not produce one, because a thread parked in a syscall is not running Go code — and running Go code is the only thing a P grants.
The runtime’s rule is narrow and worth stating exactly: GOMAXPROCS bounds the
number of threads executing Go code simultaneously. A thread that has entered
a blocking syscall has handed its P away. It is still a live OS thread with a
kernel stack and a scheduling entity; it is just not spending a P while it
waits. The same applies to threads blocked in cgo calls and to threads pinned by
runtime.LockOSThread.
So the two numbers measure different things, and nothing in the runtime keeps
them close. The thread count is driven by how many goroutines are simultaneously
blocked in calls the netpoller cannot own; GOMAXPROCS is driven by how much
CPU you want Go code to occupy. The 202-to-1 ratio above is not pathological.
It is the design working.
The only ceiling, and what it does
There is exactly one runtime-wide limit on threads, and it is not GOMAXPROCS.
runtime/debug.SetMaxThreads defaults to 10,000 and behaves like a tripwire:
GOMAXPROCS=2 /tmp/gmp maxthreads 20 200SetMaxThreads(20), GOMAXPROCS=2, blocking 200 goroutines in read(2)
runtime: program exceeds 20-thread limit
fatal error: thread exhaustionNo throttling, no queueing, no back-pressure — the process dies. That is the
documented intent, “to take down the program before it takes down the operating
system”, and it means SetMaxThreads is a fuse against runaway thread creation,
not a resource knob you tune.
The number that does set GOMAXPROCS
So GOMAXPROCS does not read the thread count. On Linux, since Go 1.25, it does
not read the machine either. Same source, same 12-core host, four CPU quotas:
for q in 1 2 2.5 0.5; do
  docker run --rm --cpus=$q -v /tmp/gmp-linux:/gmp:ro alpine:3.22 /gmp report
done
--cpus |
cpu.max |
runtime.NumCPU() |
GOMAXPROCS |
|---|---|---|---|
| 1 | 100000 100000 |
12 | 2 |
| 2 | 200000 100000 |
12 | 2 |
| 2.5 | 250000 100000 |
12 | 3 |
| 0.5 | 50000 100000 |
12 | 2 |
NumCPU still reports the host. GOMAXPROCS follows the cgroup quota. The
advice to derive GOMAXPROCS from the CPU limit yourself was correct for years
and stopped being correct in August 2025: the runtime now computes quota divided
by period from cpu.max itself, and re-reads it up to once a second.
What the quota-aware default buys
The old behaviour is still reachable, which makes the cost measurable rather
than assertable. GODEBUG=containermaxprocs=0 restores the Go 1.24 default —
GOMAXPROCS becomes NumCPU, so twelve Ps run inside a two-CPU quota.
Fixed load: 200,000 requests over 64 worker goroutines, each doing CPU work over a 4 KiB stack buffer. Twenty runs per configuration, in two batches:
docker run --rm --cpus=2 -v /tmp/gmp-linux:/gmp:ro alpine:3.22 /gmp work 200000 64
docker run --rm --cpus=2 -e GODEBUG=containermaxprocs=0 \
  -v /tmp/gmp-linux:/gmp:ro alpine:3.22 /gmp work 200000 64
GOMAXPROCS |
ops/sec, median | range | p99, median | p99 range | |
|---|---|---|---|---|---|
| default | 2 | 23,444 | 21,840–23,715 | 101µs | 99–166µs |
containermaxprocs=0 |
12 | 11,292 | 10,991–12,259 | 7.9ms | 3.3–74.1ms |
Throughput halved and the tail moved by nearly two orders of magnitude (n=20 per configuration). The tail is the more interesting number, and it is bimodal: the disabled runs cluster either around 4–9ms or around 70–74ms, with nothing in between. That gap is the mechanism showing through. The kernel enforces a CPU quota by suspending the cgroup for the remainder of the 100ms period once its budget is spent, so a request in flight at that moment waits out most of a period. Go’s own announcement makes the argument in prose — throttling “completely pauses application execution for the remainder of the throttling period” — and the 70ms cluster is what that sentence looks like in a histogram.
Note what is not in this measurement: NumGC was zero in every run. The 4 KiB
buffer does not escape, so the workload allocates nothing on the heap and the
collector never ran. The entire loss is scheduling.
Where it still surprises you
Three edges survive the fix, and all three are visible in the table above.
The floor is 2. --cpus=0.5 and --cpus=1 both produce GOMAXPROCS=2. The
runtime will not go below two unless the machine itself has fewer than two CPUs.
A pod with a 500m limit gets two Ps and the throttling that implies.
The rounding is upward. --cpus=2.5 gives three Ps, not two. At least one
widely shared write-up of the feature
says the opposite
— that fractional limits round down — and the documentation and the measurement
agree against it: Go “always rounds up to enable use of the full CPU limit”.
Pinning the value disables the updates. Setting the GOMAXPROCS environment
variable, or calling runtime.GOMAXPROCS, switches off the periodic re-read. A
deployment that still sets GOMAXPROCS from the limit at startup — the correct
practice until 1.25 — now holds a value frozen at the moment the process
started, and orchestrators do resize limits underneath running containers.
runtime.SetDefaultGOMAXPROCS puts both the default and the updates back.
What this does not measure
The workload is CPU-bound and allocation-free by construction, which is what isolates scheduling from the collector, and also what makes it unlike a real service. A service that allocates would additionally start twelve background mark workers — the runtime keeps one per P — inside a two-CPU quota, and what that costs is something I have not measured.
The container numbers come from Docker Desktop’s Linux VM on Apple silicon, not
from a bare-metal Linux host or a Kubernetes node, and cgroup v1’s
cpu.cfs_quota_us path was never exercised at all. The shapes — a quota-derived
default, a floor of two, upward rounding, a bimodal tail once the default is
disabled — should reproduce anywhere the runtime can read a cgroup. The absolute
numbers are this VM’s.
GOMAXPROCS was never the thread budget, and as of Go 1.25 it is no longer
yours to compute. What I cannot answer yet is what the right value is when the
quota is a lie — a burstable pod with a low limit and idle neighbours — because
the runtime now optimises for the limit it can read, and the CPU you actually
get is a number nothing inside the process can see.
Frequently asked
Does raising GOMAXPROCS create more OS threads?
Not in any direct sense. Between GOMAXPROCS=1 and GOMAXPROCS=12 the same workload produced 202 and 203 threads. GOMAXPROCS bounds how many threads may execute Go code simultaneously; threads blocked in syscalls, blocked in cgo calls, or locked to a goroutine are outside that bound and are created on demand.
Should I keep setting GOMAXPROCS from the CPU limit myself?
On Go 1.25 and later, no. The runtime reads the cgroup quota itself and re-reads it up to once a second. Setting the GOMAXPROCS environment variable or calling runtime.GOMAXPROCS pins the value and disables those periodic updates, so a hand-set value is strictly less adaptive than the default. runtime.SetDefaultGOMAXPROCS restores both.
What actually limits the number of OS threads a Go process can create?
runtime/debug.SetMaxThreads, which defaults to 10,000. It is a tripwire, not a throttle — when the limit is reached the runtime prints "runtime: program exceeds N-thread limit" and terminates with "fatal error: thread exhaustion". There is no mechanism that queues work to stay under a thread budget.