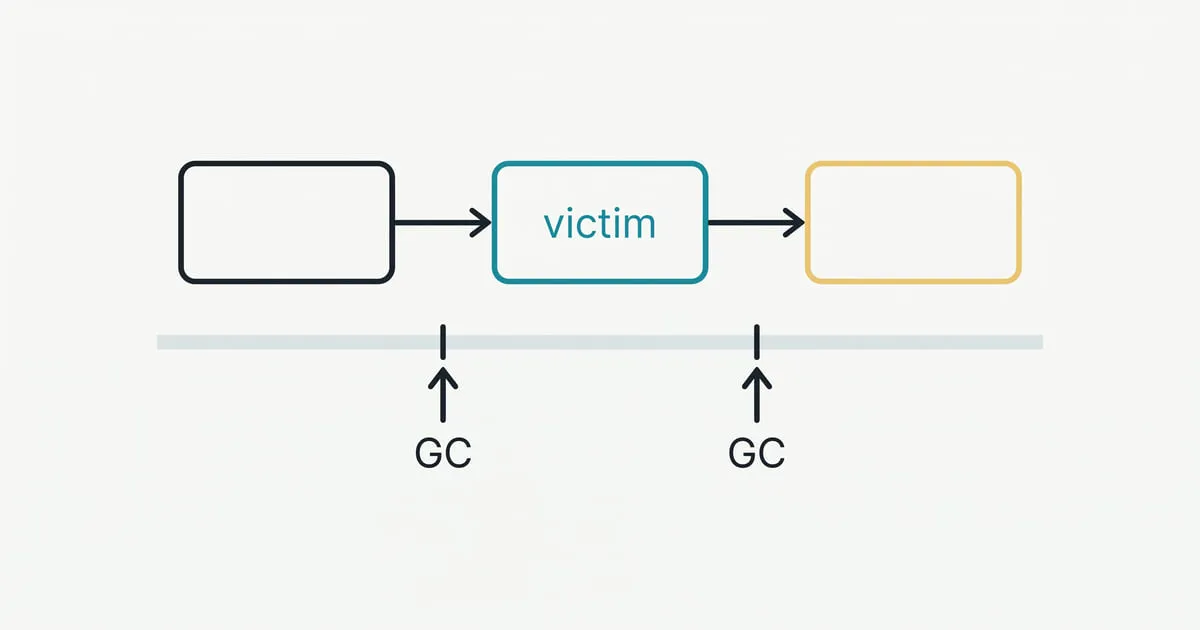
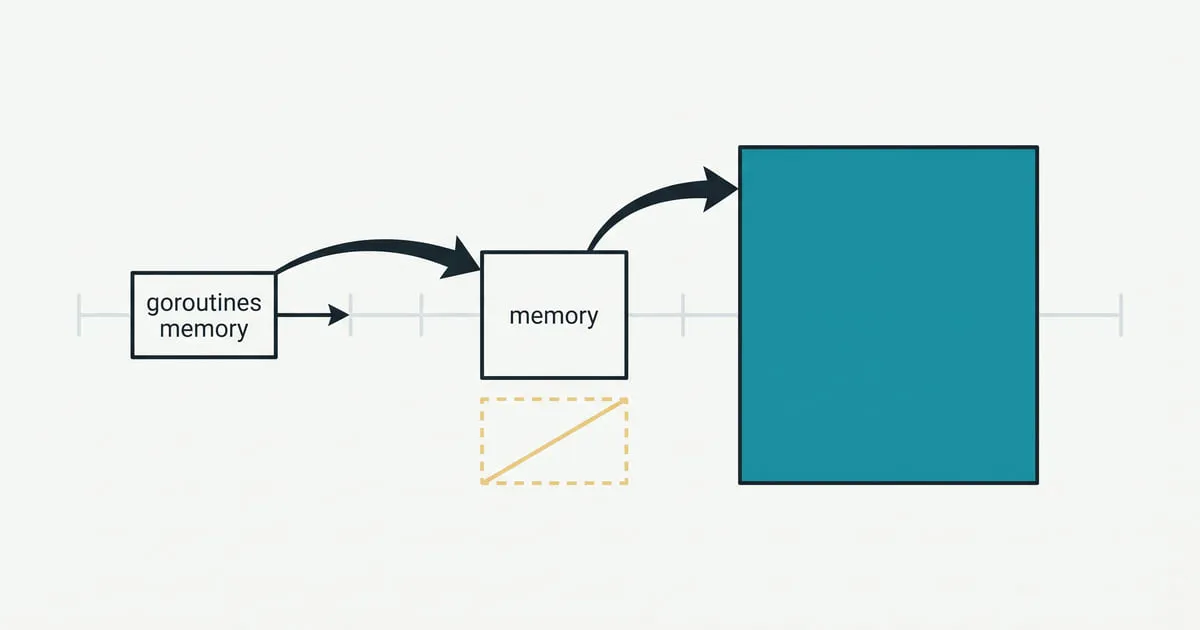
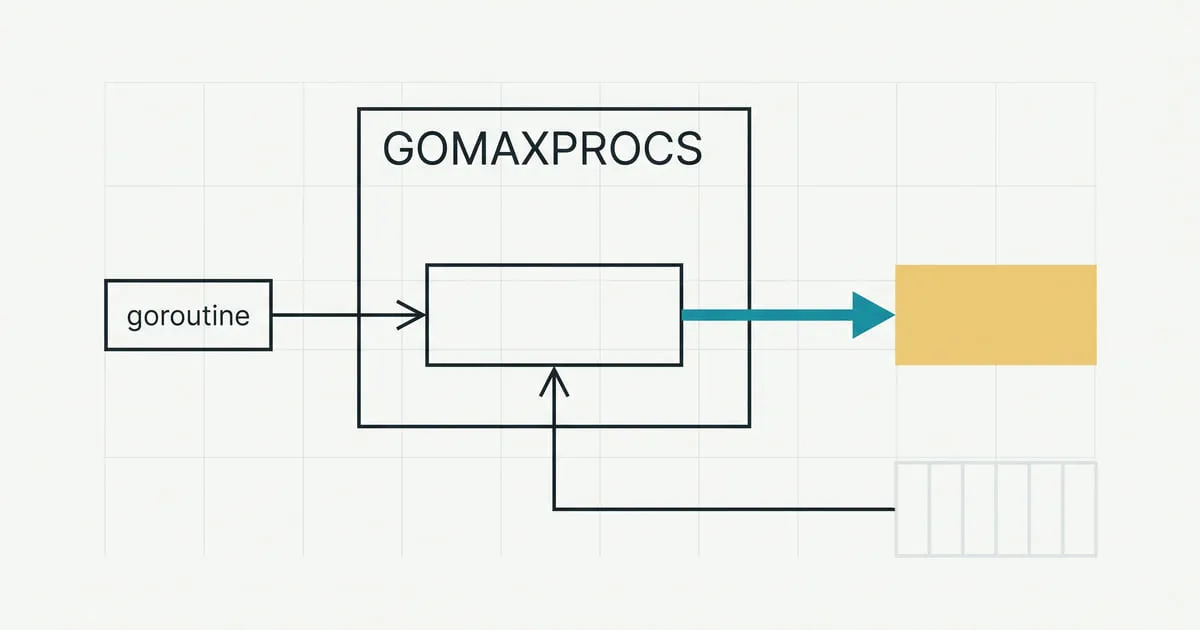
The GOGC I set next to GOMEMLIMIT never fired
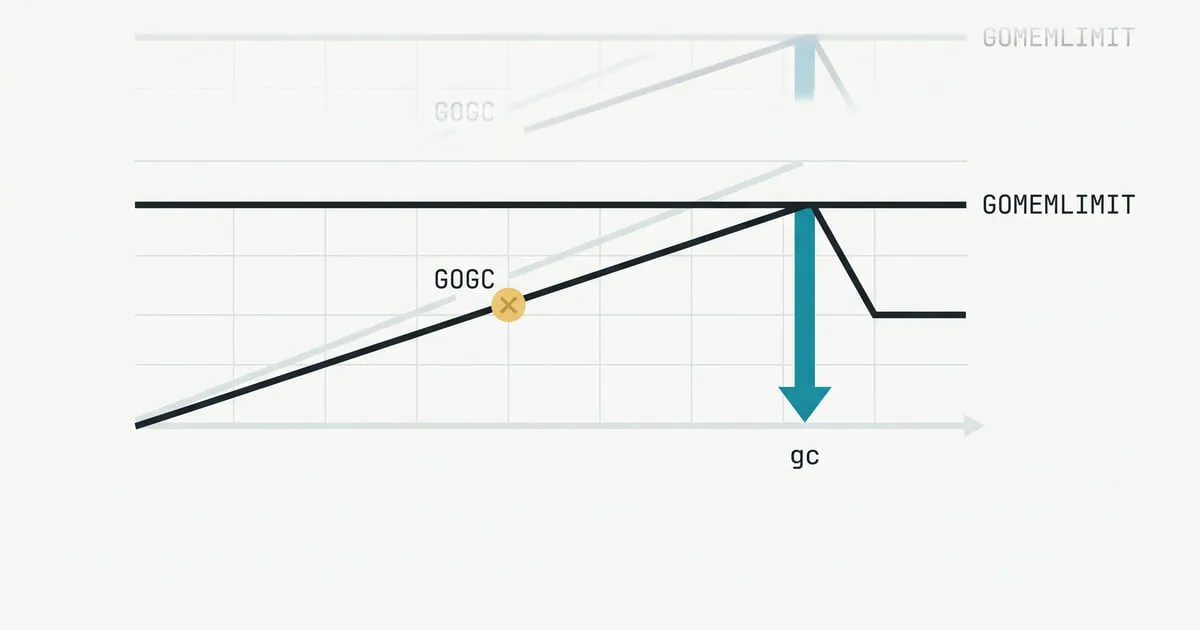
GOGC=100 with a 256 MiB limit produced exactly what GOGC=off produced: same collections, same CPU share, same throughput. The tighter rule binds, the other goes quiet.
TL;DR
- The two knobs do not combine. `GOGC=100` with `GOMEMLIMIT=256MiB` produced 2.65 M allocations/s, 288 collections and 44.9% GC CPU; `GOGC=off` with the same limit produced 2.66, 295 and 46.1%. The ratio decided nothing.
- On this workload `GOGC=100` alone and `GOMEMLIMIT=384MiB` alone are the same configuration — 4.33 against 4.41 M/s, 182 against 186 collections. Two rules, one ceiling.
- A limit five percent above the live heap cost 85% of throughput and produced no OOM. The heap goal peaked at 166.4 MiB, which is the live heap.
- The collector's CPU share is not the cost. The pointer-free workload lost 75% of its throughput under that limit while the GC's share stayed at 8.1%.
- The GC's own CPU accounting is wider than the limiter's: `/cpu/classes/gc/total` reported 64.2% in the failure case, of which 46 points is idle-time marking. The runtime's ~50% limiter governs the other 17.9%.
GOGC=100 next to a 256 MiB limit produced exactly what GOGC=off produced
with that limit alone. Same cycle count, same CPU share, same throughput — the
ratio I set never got to decide anything.
GOGC sets a growth ratio and GOMEMLIMIT sets a ceiling, and they are
described together often enough that people set both to the same intent. The
runtime does not average them. It takes whichever produces the smaller heap
goal, and the other one stops existing.
What is being measured
All numbers: go1.27.0 darwin/arm64, Apple M4 Pro, 12 cores, macOS 26.6.2. The
harness is
gclab/.
These are program runs rather than testing.B benchmarks, so benchstat does
not apply and the
control-pair method has to be replaced
with something plainer: every configuration was run five times, and every
figure below is the median with the full range printed beside it. Where the
range overlaps, the post says so instead of reporting a difference.
The machine matters more than usual here. One allocating goroutine on twelve Ps means eleven of them are idle most of the time, and an idle P is one the scheduler has nothing to give — which turns out to decide how the collector’s CPU is accounted for, further down.
The workload is a steady allocator: a live set of a fixed size, and a loop that replaces one member of it per iteration. Nothing grows, so the heap reaches a plateau and stays there — which is what makes the two knobs comparable at all, because a heap that is still growing hides which rule set the ceiling. The live set is 128 MiB of requested objects, which settles at about 167 MiB live once the allocator’s own bookkeeping is counted.
go build -o /tmp/gclab ./gclab
GOGC=100 /tmp/gclab -mode=pointer -live=134217728 -dur=6s
GOGC=off GOMEMLIMIT=384MiB /tmp/gclab -mode=pointer -live=134217728 -dur=6s
Each run reports throughput, the number of collections, the collector’s CPU share, the peak heap goal and the peak mapped memory.
Each knob on its own
GOGC first. It is a ratio: the guide gives the target as
Live heap + (Live heap + GC roots) * GOGC / 100, so 100 means “collect when the
heap has doubled”.
GOGC   M alloc/s (median, n=5)   cycles   gc cpu   goal peak   mapped peak
  25        2.38  (2.36-2.39)      345    51.3%     205.0MiB      222.7MiB
  50        3.19  (3.13-3.24)      255    39.2%     255.1MiB      264.3MiB
 100        4.33  (4.31-4.40)      182    29.2%     340.8MiB      329.4MiB
 200        6.07  (6.02-6.09)      111    18.5%     514.8MiB      502.2MiB
 400        7.84  (7.81-7.99)       67    11.3%     855.3MiB      852.6MiB
Then GOMEMLIMIT, with GOGC=off so the limit is the only rule in play:
GOMEMLIMIT   M alloc/s (median, n=5)   cycles   gc cpu   goal peak   mapped peak
    192MiB        0.90  (0.87-0.91)      411    63.1%     178.1MiB      199.0MiB
    256MiB        2.66  (2.65-2.69)      295    46.1%     240.3MiB      264.2MiB
    384MiB        4.41  (4.39-4.44)      186    29.9%     364.5MiB      387.5MiB
    512MiB        6.12  (5.56-6.27)      119    19.8%     488.7MiB      510.7MiB
Both tables trade the same thing: memory for CPU. That is not the interesting part. The interesting part is that they overlap.
Where the two rules name the same ceiling
Put the GOGC=100 row next to the GOMEMLIMIT=384MiB row:
                   M alloc/s (median, n=5)   cycles   gc cpu   goal peak
GOGC=100                4.33  (4.31-4.40)      182    29.2%    340.8MiB
GOMEMLIMIT=384MiB       4.41  (4.39-4.44)      186    29.9%    364.5MiB
The throughput ranges overlap, the cycle counts are four apart out of 184, and
the CPU shares are 0.7 points apart. These are not similar configurations; on
this workload they are the same configuration, reached by two different rules. A
167 MiB live heap with GOGC=100 targets about 340 MiB, and 384 MiB is close
enough that the pacer lands in the same place.
That coincidence is what makes the next result easy to miss in production. If your live heap happens to sit where your ratio and your limit agree, both knobs look like they work.
Setting both, and the one that goes quiet
Now both, at two different limits:
                              M alloc/s (median, n=5)   cycles   gc cpu   goal peak
GOGC=100                           4.33  (4.31-4.40)      182    29.2%    340.8MiB
GOGC=100  GOMEMLIMIT=384MiB        4.36  (3.86-4.47)      185    29.0%    344.6MiB
GOGC=off  GOMEMLIMIT=384MiB        4.41  (4.39-4.44)      186    29.9%    364.5MiB

GOGC=100  GOMEMLIMIT=256MiB        2.65  (2.61-2.66)      288    44.9%    233.9MiB
GOGC=off  GOMEMLIMIT=256MiB        2.66  (2.65-2.69)      295    46.1%    240.3MiB
The first three rows are one number three times, which is the coincidence above.
The last two are the finding: with a 256 MiB limit, setting GOGC=100 produced
the same result as turning GOGC off entirely. Overlapping throughput ranges,
cycle counts seven apart out of nearly three hundred, CPU shares 1.2 points
apart.
GOGC=100 on a 167 MiB live heap asks for a goal around 340 MiB. The limit asks
for 240. The runtime takes the smaller, every cycle, and the ratio is never the
binding constraint. It is not moderating the limit and the limit is not
moderating it — one of them is simply not in the calculation.
Which one that is depends on the live heap, and the live heap moves. A service whose working set grows past the crossover swaps which knob is live, silently, with no configuration change and no log line.
The limit that sits too close
The failure mode is the case worth the reader’s time. Set the limit just above the live heap — 176 MiB against a 167 MiB live set, about five percent of headroom:
                              M alloc/s (median, n=5)   cycles   gc cpu   goal peak
GOGC=100 (no limit)                4.33  (4.31-4.40)      182    29.2%    340.8MiB
GOGC=off  GOMEMLIMIT=176MiB        0.66  (0.65-0.67)      394    64.2%    166.4MiB
85% of throughput, gone. And no OOM: the limit is defined as soft, so the runtime does not fail when it cannot meet it — it collects harder and keeps going. The heap goal peaked at 166.4 MiB, which is the live heap itself. The pacer is asking for a target it can never reach by collecting, because there is nothing left to collect.
The Go GC guide calls this thrashing and describes it exactly:
This situation, where the program fails to make reasonable progress due to constant GC cycles, is called thrashing. It’s particularly dangerous because it effectively stalls the program.
A stall is worse to diagnose than a crash. Nothing dies, no restart happens, the
memory metric looks obedient — it is pinned at the limit, which is what you
asked for — and the throughput graph is the only place the problem appears. This
is L3’s result arriving from the other side: how often the collector runs is
exactly how fast a sync.Pool empties, and here it is running constantly.
The collector’s CPU share is not the cost
That 64.2% needs an argument with itself, because the guide says the runtime caps
the GC at “roughly 50%” of CPU with a 2 * GOMAXPROCS window.
Both are true. /cpu/classes/gc/total is the sum of four children, and one of
them is mark/idle — mark work performed on a P that had nothing else to run.
That work is charged to the collector but costs the application nothing it was
using, and the limiter does not govern it. In the failing run:
$ GOGC=off GOMEMLIMIT=176MiB /tmp/gclab -mode=pointer -live=134217728 -dur=6s
gc cycles    396 (one every 15.214ms)
gc cpu       46.58s of 72.23s = 64.5%
gc cpu net   18.0% excluding idle-time marking (what the ~50% limiter governs)
gc cpu split assist 0.16s · dedicated 12.77s · idle 33.58s · pause 0.07s
That is the median of the five runs, printed whole. Thirty-four of the
forty-seven collector-seconds are idle marking. This workload is one
goroutine on twelve cores, so eleven Ps are usually free and the collector helps
itself to them. A GC CPU share computed from /cpu/classes/gc/total on an
under-subscribed machine is not comparable to the limiter’s ceiling. Subtract
/cpu/classes/gc/mark/idle first.
Then the sharper version. Run the same workload with pointer-free objects — identical size, identical allocation rate, nothing for the mark phase to follow:
                              M alloc/s (median, n=5)   cycles   gc cpu
scalar, no limit                   8.28  (8.15-8.45)      309     2.5%
scalar, GOMEMLIMIT=176MiB          2.11  (2.07-2.17)      966     8.1%
It lost 75% of its throughput while the collector’s share never passed 8.1%. The cost was not CPU spent collecting. It was 966 collections in six seconds — one every 6.2 ms — and an allocator that spends its time waiting behind them.
So a low GC CPU share does not clear the collector of suspicion. Read the cycle count.
What this does not measure
Pause time, entirely. The stop-the-world total in the failing run was 13.99 ms across 396 cycles — about 35 µs each, which is not where the 85% went. A p99 story needs a request-shaped workload and a different harness.
The live set here is fixed by construction, which is the property that made the
comparison possible and also the one real services do not have. The interesting
case for a soft limit is a transient spike, where GOMEMLIMIT is supposed to
absorb what GOGC would have turned into an OOM. This workload cannot produce
that shape, and I have not measured it.
One goroutine on twelve cores is also what made the idle-marking share so large. On a machine with no spare Ps that 46-point gap closes, the collector’s accounting and the limiter’s converge, and the numbers in the first two tables would look different — probably worse, because the mark work would have to displace application work instead of filling gaps.
And nothing here says what to set. It says which of the two settings is currently deciding, which is a prerequisite rather than an answer.
Frequently asked
Should I set both GOGC and GOMEMLIMIT?
You can, but only one of them will be doing anything. The runtime takes the smaller of the two heap goals, so whichever rule is tighter on your current live heap sets the ceiling and the other is inert until the live heap moves far enough to swap them. In the runs below, GOGC=100 alongside a 256 MiB limit produced the same cycle count, CPU share and throughput as GOGC=off alongside that limit — the ratio never got to decide anything.
What happens when GOMEMLIMIT is close to the live heap?
Not an OOM. The limit is soft, so the runtime collects harder instead of failing: at a limit five percent above the live heap the workload below fell from 4.33 to 0.66 million allocations per second, an 85% loss, while the heap goal sat on the live heap itself. The Go GC guide calls this thrashing, and it is a stall rather than a crash — which is worse to diagnose, because nothing in the process dies.
My GC CPU share is above 50%. Is the runtime's limiter broken?
Probably not; the number is measuring something wider than the limiter governs. /cpu/classes/gc/total includes mark work performed on Ps that had nothing else to run, and that work costs the application nothing it was using. In the failure case below the total was 64.2% while the share excluding idle-time marking was 17.9%. Subtract /cpu/classes/gc/mark/idle before comparing against the roughly 50% ceiling.
Does a low GC CPU share mean the collector is not my problem?
No. The pointer-free workload below lost three quarters of its throughput under a tight limit while the collector never took more than 8.1% of CPU. What slowed it down was collection frequency — 966 cycles in six seconds — not the CPU those cycles consumed. Read the cycle count next to the CPU share, not instead of it.