Only 54 µs of that 68 ms collection was a pause
A gctrace line carries eleven numbers. Two are stop-the-world, one has a third of the GC subtracted out of it, and the biggest one is not a pause at all.
TL;DR
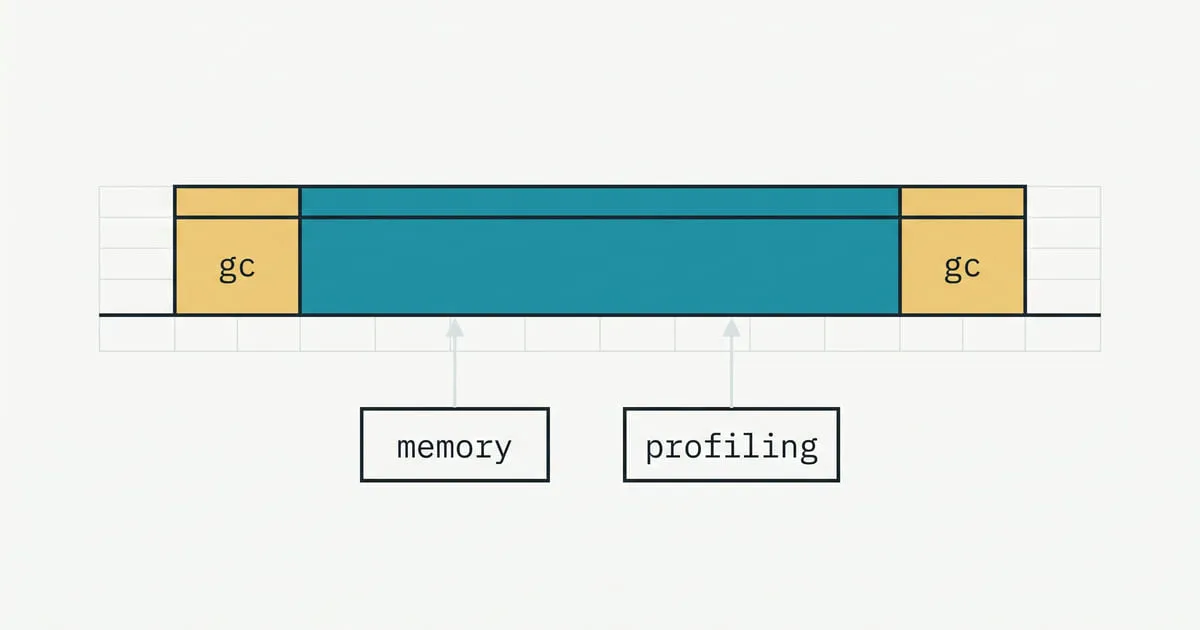
- The large number in the middle of a `gctrace` line is concurrent mark, measured in wall clock, and the program runs through all of it. In the line annotated below it is 68 ms; the stop-the-world total beside it is 54 µs.
- The percentage the line opens with is not the collector's CPU share. The runtime subtracts idle-time marking first — `(GCTotalTime - GCIdleTime) / TotalTime` — so the same run reported 16.3% from `/cpu/classes/gc/total` and 11% in the trace.
- The `#+#/#/#+# ms cpu` section is CPU-seconds summed across all Ps, so its middle three numbers can and do exceed the wall clock beside them.
- Assist time is the field that says the mutator is paying — 0.07s across a healthy run against 1.51s in a thrashing one, same workload, same duration.
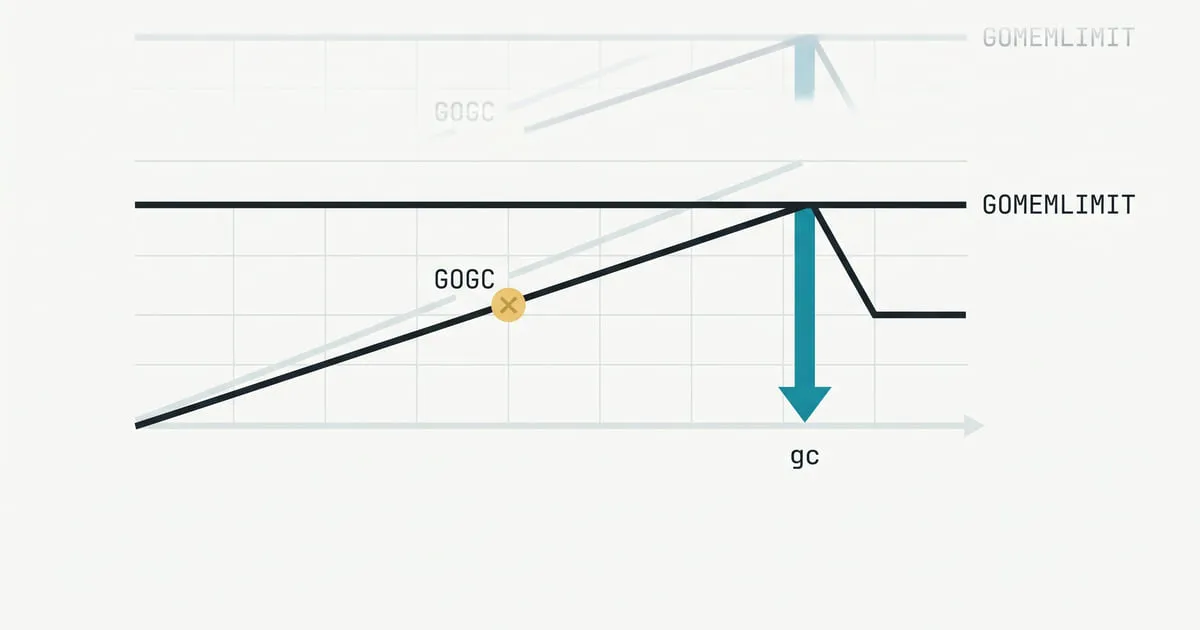
- When the goal is printed below the live heap — `165->181->168 MB, 165 MB goal` — the collector is chasing a target it has already passed.
gc 32 @2.821s 11%: 0.038+68+0.016 ms clock, 0.46+0.97/165/82+0.19 ms cpu, 312->342->182 MB, 363 MB goal, 0 MB stacks, 0 MB globals, 12 P
That line contains a 68 and a 165 and a 182 and a 363, and the number most people take from it — how long the collector stopped the program — is 0.054, and it is not written down.
The setup
All numbers: go1.27.0 darwin/arm64, Apple M4 Pro, 12 cores, macOS 26.6.2. The
harness is
gclab/,
the same steady allocator behind
the GOGC and GOMEMLIMIT comparison.
go build -o /tmp/gclab ./gclab
GODEBUG=gctrace=1 /tmp/gclab -mode=pointer -live=134217728 -dur=6s \
  -heapprofile=/tmp/gc-healthy.pprof
The format is documented in go doc runtime, which is worth quoting because it
also carries a warning:
The format of this line is subject to change.
Everything below is go1.27.0. If your go version says something else, check
the fields against your own toolchain before trusting the order.
Field by field
gc 32                      the GC number, incremented at each GC
@2.821s                    time since program start
11%                        GC CPU since start — see below, it is not what you think
0.038+68+0.016 ms clock    STW sweep termination + concurrent mark + STW mark termination
0.46+0.97/165/82+0.19 ms cpu   the same three phases in CPU across all Ps,
                               with mark split into assist / background / idle
312->342->182 MB           heap at cycle start, at cycle end, and live
363 MB goal                what the pacer was aiming at
0 MB stacks, 0 MB globals  scannable stack and global size
12 P                       GOMAXPROCS
12 P at the end is not decoration: it is the divisor for everything in the CPU
section, and half the fields only make sense once you know
what a P is and when it has nothing to do.
Two sections, three phases each, and the phases are the same three both times. The documentation names them: “stop-the-world (STW) sweep termination, concurrent mark and scan, and STW mark termination”.
The last two size fields read 0 MB here and that is a property of the harness,
not a formatting quirk. stacks is the estimated scannable stack size and
globals the scannable global size, and both are roots the collector must walk
before it can follow anything else. One goroutine with a shallow stack and a
handful of package variables rounds to zero. A service with fifty thousand
goroutines does not, and on those the stack figure is the field that explains
why a cycle costs more than its heap size suggests — a goroutine’s stack is
scanned whether or not it allocated anything.
The two numbers your p99 can see
The clock section is 0.038+68+0.016. The first and third are stop-the-world.
The middle one is not.
Stop-the-world total: 0.054 ms. Concurrent mark: 68 ms, during which the program allocated, served requests and did everything else it does, with the collector marking on other Ps beside it. Those 68 milliseconds are in your latency only to the extent that the collector was competing for CPU, and that competition is what the next section measures.
Three orders of magnitude separate the number that stops your program from the number next to it, and nothing in the line’s punctuation says which is which. That is the misreading this post exists for.
The percentage is not the CPU share
The line opens with 11%, and go doc runtime describes it as “percentage of
time spent in GC since program start”. The same run’s own metrics disagree:
gc cpu       11.89s of 72.78s = 16.3%
gc cpu net   11.8% excluding idle-time marking
16.3% from /cpu/classes/gc/total, 11% in the trace. The trace is not wrong and
neither is the metric — they are different quantities, and the runtime says so
in a comment above the line that computes it
(mgc.go):
// Compute overall GC CPU utilization.
// Omit idle marking time from the overall utilization here since it's "free".
memstats.gc_cpu_fraction = float64(work.cpuStats.GCTotalTime-work.cpuStats.GCIdleTime) / float64(work.cpuStats.TotalTime)
Mark work done on a P that had nothing else to run is charged to the collector
in /cpu/classes/gc/total and subtracted here, because it cost the application
nothing it was using. On this machine — one allocating goroutine, twelve Ps —
the gap is 4.5 points. On a saturated machine the two converge, because there is
no idle P to give the work to.
The practical consequence: the trace’s percentage is the one to quote, and the metric is the one that will confuse you.
The heap triple, against a profile
312->342->182 MB is the heap at the start of the cycle, at the end, and the
live set. It grew from 312 to 342 during the concurrent mark, which is the
program allocating while marking ran — and then 182 of it survived.
That last figure is checkable. The harness forces a collection at the end of the run and writes a heap profile immediately after, so the two describe the same moment:
gc 63 @6.086s 11%: ... 239->239->153 MB, 354 MB goal, ... 12 P (forced)

$ go tool pprof -top -nodecount=4 -sample_index=inuse_space /tmp/gc-healthy.pprof
Showing nodes accounting for 150.13MB, 99.67% of 150.63MB total
  142.62MB 94.69% 94.69%   142.62MB 94.69%  main.newPtr
153 MB in the trace, 150.63 MB in the profile — 1.6% apart, which is the heap
profile’s sampling rate rather than a disagreement. The (forced) suffix marks
the one collection in the trace that the pacer did not schedule.
Three settings, one live heap
The same program under three GC configurations, one representative line each:
GOGC=400
gc 10 @2.046s  5%: 0.049+66+0.017 ms clock, ... 908->942->187 MB, 959 MB goal

GOGC=100 (default)
gc 32 @2.821s 11%: 0.038+68+0.016 ms clock, ... 312->342->182 MB, 363 MB goal

GOGC=off GOMEMLIMIT=176MiB
gc 62 @2.768s 18%: 0.13+34+0.006 ms clock, ... 165->181->168 MB, 165 MB goal
The live heap barely moves — 187, 182, 168 MB. The goal moves by a factor of nearly six, and the utilisation figure with it. That is the knob that set it, visible in one field.
The third line is the one to learn. The goal, 165 MB, is below the live figure, 168 MB. The pacer is asking for a heap smaller than what is reachable, which collection cannot produce; it collects again immediately and prints another line like it. The three runs completed 24, 62 and 118 collections in the same six seconds.
When assists are doing the work
The mark CPU section splits three ways — 0.97/165/82 — and the documentation
names them: “assist time (GC performed in line with allocation), background GC
time, and idle GC time”.
Assist is the one to watch, because it is the only one billed to the goroutine that was trying to allocate. The pacer runs a credit system: a goroutine that allocates faster than the collector is marking goes into debt and has to mark before its allocation returns. Background time is the dedicated workers, which cost the application a share of its Ps; idle time is free. Assist time is the allocation call itself taking longer, which is the only one of the three that lands inside a single request.
Across the two full runs:
healthy   gc cpu split assist 0.07s · dedicated 8.51s · idle 3.28s · pause 0.03s
pressed   gc cpu split assist 1.51s · dedicated 11.91s · idle 9.28s · pause 0.05s
Twenty-one times the assist time, from the same workload for the same six seconds. When a service slows down under GC pressure without its stop-the-world numbers moving, this is usually where the time went: the allocating goroutines were made to mark before they were allowed to allocate.
The @ field is worth reading alongside it. Cycle 62 at @2.768s and cycle 63
at @2.805s are 37 ms apart, against 98 ms between cycles in the healthy run and
253 ms in the loose one. Two adjacent lines give you the collection interval for
free, and that interval — not the CPU share — is what
a sync.Pool actually feels, because the
pool is emptied on a schedule counted in cycles rather than in seconds.
What this does not cover
The format is version-specific and says so. These are go1.27.0 fields in
go1.27.0 order, and the two extra fields at the end — stacks and globals — read
0 MB here only because the harness has almost no globals and one goroutine.
Nothing here explains the mark phase itself. What changed inside it recently, and which heaps that change helps, is a separate measurement; this post reads what the phase reports rather than what it does.
And a line is not a trace. gctrace gives you one summary per collection with no
timeline, so it will tell you that assists climbed and not which handler was
allocating when they did. That is go tool trace, and it answers a different
question at a much higher price.
Frequently asked
Is the big millisecond number in gctrace a pause?
No. The three clock numbers are stop-the-world sweep termination, concurrent mark, and stop-the-world mark termination, in that order. Only the first and last stop your program. In the line below they are 0.038 ms and 0.016 ms against 68 ms of concurrent mark — the program ran normally for all 68 of those milliseconds while the collector marked alongside it.
Why is the CPU time larger than the clock time in a gctrace line?
Because the clock figures are wall time and the CPU figures are summed across every P. On a 12-P machine a 68 ms concurrent mark can legitimately report 248 ms of CPU. They are not two measurements of the same thing, which is why they sit in separate sections of the line.
Does the gctrace percentage match runtime/metrics?
Not the obvious metric. The trace prints memstats.gc_cpu_fraction, which the runtime computes as (GCTotalTime - GCIdleTime) / TotalTime with the comment "Omit idle marking time from the overall utilization here since it's free". So it corresponds to /cpu/classes/gc/total minus /cpu/classes/gc/mark/idle, over /cpu/classes/total. On an under-subscribed machine the difference is large: 16.3% against 11% in the same run.
How do I tell from a gctrace line that the GC is in trouble?
Two signals. The goal stops moving and sits at or below the live figure in the heap triple, which means the pacer is asking for something collection cannot deliver. And the assist number — the first of the three mark CPU figures — climbs, because the allocating goroutines are being made to do the marking themselves. In the runs below assists went from 0.07s to 1.51s between a healthy configuration and a thrashing one.