Green Tea cut my GC time 63%, and raised it 39%
One heap shape lost 63% of its collector CPU and gained 14% throughput. Another gained 39% collector CPU and lost nothing. Same flag, same binary pair, same machine.
TL;DR
- Three heap shapes, one binary pair, seven runs each. A heap of many small same-sized objects lost 63.5% of its collector CPU and gained 14.5% throughput; a heap of large pointer-free objects gained 39.3% collector CPU and gained no throughput at all.
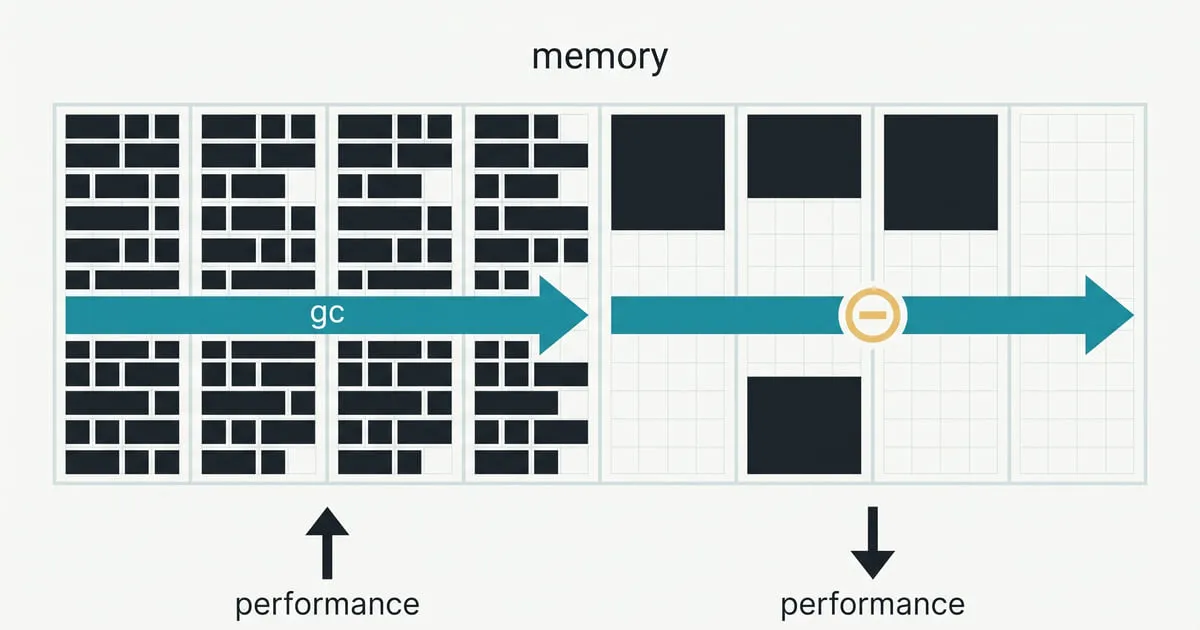
- Green Tea scans pages instead of objects, so the question is not how much garbage a program makes but how densely the interesting objects pack onto a page.
- Both published reports are right. The release notes' 10–40% and DoltHub's "doesn't make any difference" are measurements of different heaps, and this is the map between them.
- The 39% regression cost nothing measurable — 7.00 against 7.03 M allocations/s with overlapping ranges. A large relative change on a 2.8% base is 1.1 points.
- The opt-out survives. Go 1.26's notes expected `GOEXPERIMENT=nogreenteagc` to be removed in Go 1.27; Go 1.27's notes do not mention it, and it still builds.
The same flag cut one workload’s collector CPU from 18.9% to 6.9% and pushed another’s from 2.8% to 3.9%.
Both are Green Tea, both on go1.27.0, both measured seven times on an idle
machine — and the only thing that differs between them is the shape of the heap.
Go 1.26’s release notes promise “somewhere between a 10–40% reduction in garbage
collection overhead in real-world programs that heavily use the garbage
collector”. A team at DoltHub measured their database and reported that “the
Green Tea collector doesn’t make any difference in real-world performance
numbers”. Neither of them is wrong.
What is being measured
All numbers: go1.27.0 darwin/arm64, Apple M4 Pro, 12 cores, macOS 26.6.2. The
harness is
gclab/,
the same steady allocator behind
the GOGC and GOMEMLIMIT comparison.
Program runs rather than benchmarks, so every configuration ran seven times
and every figure is the median with the observed range beside it. Where two
ranges overlap, the post reports no result.
The A/B is a same-binary comparison because the escape hatch still exists:
go build -o /tmp/gclab ./gclab
GOEXPERIMENT=nogreenteagc go build -o /tmp/gclab-nogt ./gclab
go version -m /tmp/gclab-nogt | grep GOEXPERIMENT
#   build GOEXPERIMENT=nogreenteagc
That is worth stating plainly, because it was supposed to be gone. Go 1.26’s notes said the opt-out “is expected to be removed in Go 1.27”; Go 1.27’s release notes do not mention Green Tea or the flag at all, and it builds.
One caveat before the shapes. This is one allocating goroutine on twelve Ps, so most of the mark work lands on Ps that had nothing else to run — the state the scheduler puts a P in when its goroutine is not runnable. It inflates every absolute figure below and mostly cancels in the ratios, which is why the comparison survives it and the raw numbers do not travel.
Three heap shapes, each holding the same 128 MiB of requested live objects:
- graph — 4 million 32-byte nodes, each carrying two pointers into a separate 64 MiB pool of long-lived nodes chosen by hash. Many small objects of one size, all packed into the same size class.
- pointer — 768-byte objects, each 96 pointer slots addressing one shared contiguous array. Pointer-dense, but the targets are trivial to reach.
- scalar — 768-byte objects with no pointers in them at all. The same bytes, the same allocation count, nothing for the mark phase to follow.
The shape it was built for
$ for rep in 1 2 3 4 5 6 7; do
    /tmp/gclab      -mode=graph -live=134217728 -dur=6s
    /tmp/gclab-nogt -mode=graph -live=134217728 -dur=6s
  done
graph M alloc/s (median, n=7) gc cpu % mark dedicated
Green Tea 16.84 (16.44-17.18) 6.9 (6.6-7.1) 1.57s
no Green Tea 14.70 (13.82-15.20) 18.9 (18.0-19.3) 4.35s63.5% off the collector’s CPU share, and 14.5% more application throughput. No range overlaps its counterpart on any of the three columns. That is past the top of the 10–40% the release notes lead with, on a workload built to be the best case.
The mechanism is in the Go team’s own design post, and it is not about garbage volume:
Instead of scanning objects we scan whole pages. Instead of tracking objects on our work list, we track whole pages.
An 8 KiB page holding 256 32-byte nodes that all need marking is one unit of
work with excellent locality. The same page under the old design is 256
separate visits, each following a pointer somewhere else. The post names the
winning case exactly: “objects of the same size at a similar depth in the object
graph”. That is the graph mode’s definition.
The shape where it does almost nothing
pointer              M alloc/s (median, n=7)   gc cpu %   mark dedicated
Green Tea               3.53   (3.43-3.78)     27.0 (26.4-27.2)    6.29s
no Green Tea            3.43   (3.29-3.74)     28.2 (28.0-28.9)    6.40s
The collector’s CPU share fell by 4.3%, and the ranges do not overlap, so that is real. Everything else is not: the throughput ranges overlap, and so do the dedicated mark seconds. A 1.2-point improvement in a share that the application never got back is not something anyone will see on a dashboard.
This shape is pointer-dense — 96 pointers per object, forty-eight times what the graph nodes carry — and it gains almost nothing. Pointer density is the intuition people reach for and it is the wrong axis. What matters is how much of a page the collector can do at once, and a heap of 768-byte objects gives it ten per page instead of 256.
The shape where it costs a little
scalar               M alloc/s (median, n=7)   gc cpu %   mark dedicated
Green Tea               7.03   (6.79-7.07)      3.9  (3.4-4.0)     1.73s
no Green Tea            7.00   (6.81-7.11)      2.8  (2.8-3.0)     1.68s
The collector’s share went up 39.3%, and the ranges do not overlap. This is the case the design post warns about:
some workloads that often require us to scan only a single object per page at a time. This is potentially worse than the graph flood.
And it cost nothing. Throughput was 7.03 against 7.00 with overlapping ranges; the dedicated mark seconds overlap too. A 39% increase on a 2.8% base is 1.1 points of a program the collector was never the bottleneck for.
That gap between a large relative change and no absolute consequence is the single most useful thing in this table, because it is what a monitoring dashboard shows you and what a latency graph does not.
Why both published reports are right
DoltHub ran sysbench oltp_read_write against Dolt in September 2025, with Go
1.25’s GOEXPERIMENT=greenteagc, and found no change in throughput or latency —
while noting that “Green Tea is consistently spending more CPU time during mark
at every garbage collection”. Read next to the table above, that is the scalar
row: a small increase in mark CPU that does not reach the application.
The release notes’ 10–40% is the graph row’s neighbourhood, and the design
post gives 10% as “roughly the modal improvement”. A database’s heap is a mixture
of shapes, and the mixture is what decides where in that range a program lands —
or whether it lands outside it, in either direction.
So the question to ask of your own service is not how much garbage it makes.
The GC frequency that a sync.Pool feels
does not change here at all: the cycle counts are 16 against 15 in graph, 148
against 144 in pointer. What changed is the cost of each mark, and that is
decided by how many objects the collector can retire per page.
What this does not measure
The amd64 path, which should be better than anything here. The Go 1.26 notes
promise a further ~10% on Ice Lake, Zen 4 and newer, where the collector uses
vector instructions for scanning small objects. This is arm64 and cannot take
that path, so the graph result is the base improvement without it.
Pause time, which barely moved and was never the claim. Real heaps, which are mixtures rather than one shape — three synthetic modes bracket the behaviour, they do not model a service.
And the comparison is Green Tea against the collector it replaced inside go1.27.0, not against Go 1.25. The old mark implementation still ships behind the flag, but it has had two releases of unrelated runtime changes around it, so this is not the same experiment as upgrading a service from 1.25 to 1.26.
One measurement I could not make honestly the first time: the first A/B run was
taken while this machine was also making network requests, and the pointer
throughput range widened from ±1% to ±10%. The graph result would have survived
it — a 2.6-fold difference does not care — but a widened range manufactures
“no difference” for free, and two of the three shapes here report exactly that.
The run was repeated on an idle machine, and the discarded one is in the harness
repository next to the one that counts.
Frequently asked
Why did Green Tea do nothing for my service?
Probably because of what your mark phase spends its time on rather than how much of it there is. Green Tea scans whole pages instead of individual objects, so it wins where many small same-sized objects pack densely onto the same page and it does not win where a page holds one interesting object. In the runs below the small-object heap lost 63.5% of its collector CPU while the large-object heap gained 39.3% — the same flag, the same machine, the same afternoon.
Can Green Tea make things worse?
It made the collector's CPU share worse on one of the three shapes measured here, from 2.8% to 3.9%, with the ranges not overlapping across seven runs. It did not make the program worse: throughput was unchanged. The Go team's own design post names this case, warning about workloads that "require us to scan only a single object per page at a time. This is potentially worse than the graph flood."
Is GOEXPERIMENT=nogreenteagc still available?
Yes, on go1.27.0 and go1.27.1. Go 1.26's release notes said the opt-out was "expected to be removed in Go 1.27", and Go 1.27's release notes do not mention Green Tea or the opt-out at all. A binary built with it carries build GOEXPERIMENT=nogreenteagc in go version -m output, which is how the A/B below is kept honest.
Do these numbers apply on amd64?
Not directly, and the amd64 figures should be better. The Go 1.26 notes promise a further ~10% reduction on Intel Ice Lake, AMD Zen 4 and newer, where the collector uses vector instructions for scanning small objects. This machine is arm64 and cannot take that path, so what is measured below is the base improvement only.