Category: Performance and measurement
The heap profile named a function I did not write
Same program, two sample types. alloc_space blames my function for 100% of it; inuse_space blames the runtime's scavenger, and both are correct.
TL;DR
- One program allocated 782.4 MiB and kept 1.1 MiB of it. `alloc_space` attributes 100% of that to my function; `inuse_space` attributes 89.69% to `runtime.mallocgc` and 10.01% to me.
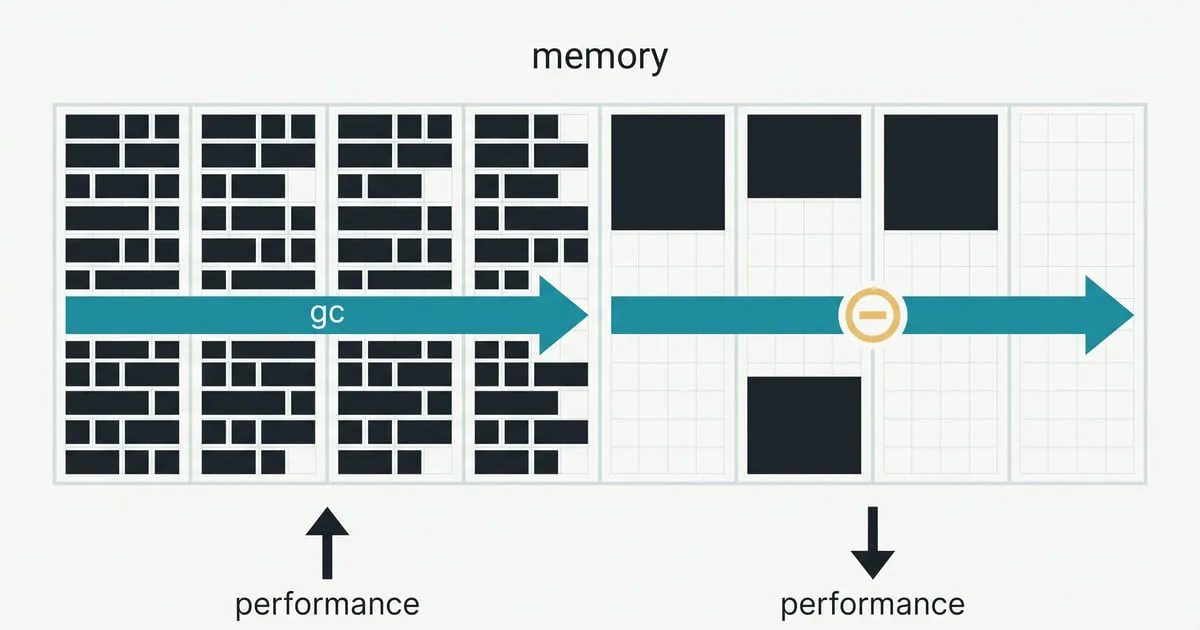
- Neither profile is wrong. They answer different questions — what churned, and what is still here — and a program with a small live set has almost nothing for the second one to find.
- The other program allocated 33.0 MiB and kept 32.5 MiB. All four sample types name the same function at 99.4% or better, because there is no difference between churn and live set to disagree about.
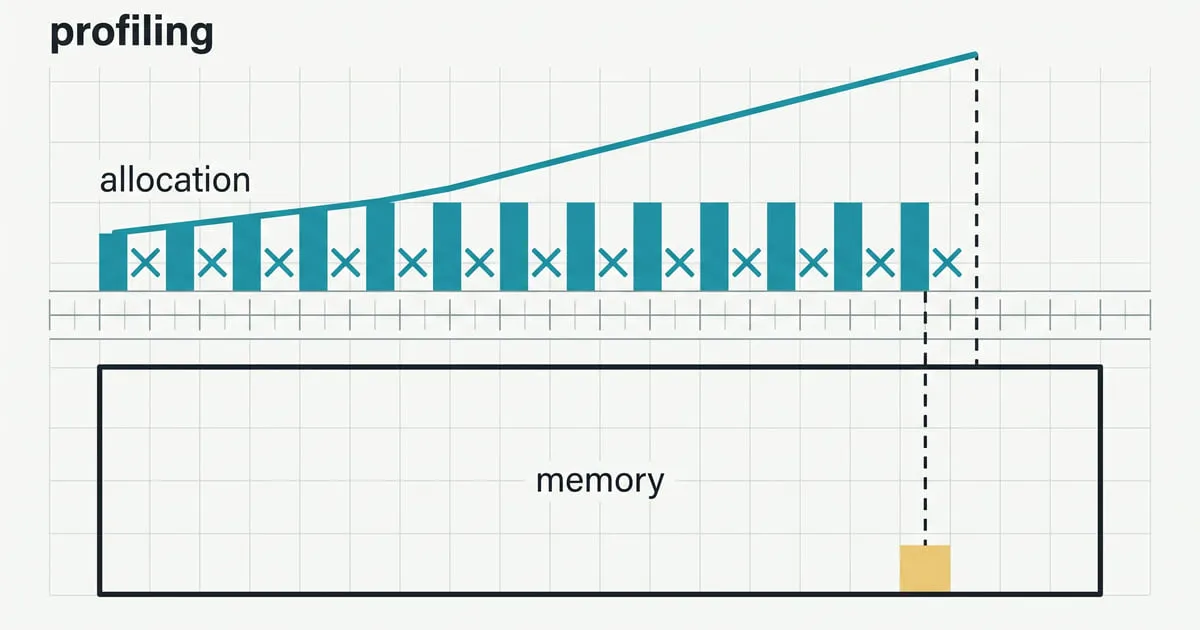
- A heap profile is a sample. At the default `MemProfileRate` of 512 KiB, the churning program's 1.1 MiB live heap is about two samples, and the profile it produces is noise with a legend.
- `inuse_objects` on that program named `runtime.mallocgcSmallScanNoHeaderSC2` at 86.32%, reached from `runtime.(*scavengerState).sleep` — the runtime profiling its own bookkeeping, because there was nothing else left.
The same program, profiled twice at the same instant. alloc_space says one
function is responsible for 100% of the heap. inuse_space says
runtime.mallocgc is responsible for 89.69% of it and my function for 10.01%.
Both are correct, and reading the wrong one sends you to optimise a function that was never the problem.
What is being measured
All numbers: go1.27.0 darwin/arm64, Apple M4 Pro, 12 cores, macOS 26.6.2. The
harness is
heapprof/.
Two programs with deliberately opposite heaps:
- churn allocates 200,000 buffers of 4 KiB and abandons each one immediately.
- retain allocates 8,000 of the same buffers and appends every one to a slice it keeps.
go build -o /tmp/heapprof ./heapprof
/tmp/heapprof -mode=churn  -out=/tmp/churn.pprof
/tmp/heapprof -mode=retain -out=/tmp/retain.pprof
go tool pprof -top -sample_index=alloc_space /tmp/churn.pprof
A heap profile is a sampled measurement, which puts it in the same category as a benchmark delta: the number is real and the question is what it is a number of. That turns out to matter twice below — once for which function gets blamed, and once for the sampling rate.
Each run forces a collection before writing the profile — otherwise
inuse_space reports objects that are unreachable but not yet swept, which
looks exactly like a leak.
mode     allocated                    live
churn    782.4 MiB / 200,821 objects  1.1 MiB / 714 objects
retain    33.0 MiB /   8,746 objects  32.5 MiB / 8,621 objects
churn allocates 23.7 times as many bytes as retain and keeps 29.5 times
fewer. 0.14% of what it allocates survives; 98.5% of what retain allocates
does. Everything below follows from those two fractions.
The profile that agrees with itself
Take retain first, because it is the boring case and the boring case is the
one people generalise from. All four sample types, same program, same moment:
alloc_space     31.93MB 99.89%   main.retainBuffers
alloc_objects      8030 99.36%   main.retainBuffers
inuse_space     31.45MB 99.89%   main.retainBuffers
inuse_objects      8001 99.37%   main.retainBuffers
One function, four times, at 99.4% or better. When a program keeps what it allocates there is no difference between churn and live set for the two questions to disagree about, and picking the wrong sample type costs nothing.
That is why the distinction feels academic until it isn’t.
The profile that does not
Now churn:
$ go tool pprof -top -nodecount=4 -sample_index=alloc_space /tmp/churn.pprof
Showing nodes accounting for 781.25MB, 100% of 781.29MB total
      flat  flat%   sum%        cum   cum%
  781.25MB   100%   100%   781.25MB   100%  main.churnBuffers

$ go tool pprof -top -nodecount=4 -sample_index=inuse_space /tmp/churn.pprof
Showing nodes accounting for 46.39kB, 99.70% of 46.53kB total
      flat  flat%   sum%        cum   cum%
   41.73kB 89.69% 89.69%    41.88kB 89.99%  runtime.mallocgc
    4.66kB 10.01% 99.70%     4.66kB 10.01%  main.churnBuffers
alloc_space names my function and nothing else. inuse_space names
runtime.mallocgc — the allocator’s own bookkeeping — and puts my function
fourth-of-a-percent behind it in a total of 46 kB.
Neither is a bug. The program allocated 782 MiB and kept 46 kB of it, so an
inuse profile has 46 kB to distribute and most of what survives a collection
in a program like this belongs to the runtime rather than to the program. A
profile with nothing in it still ranks what is there.
The failure mode is not misreading a number. It is opening a profile, seeing a runtime function at the top, and concluding the runtime is the problem.
The sample type that names the scavenger
It gets more pointed at the default sampling rate. inuse_objects on the same
program:
     32768 86.32% 86.32%   runtime.mallocgcSmallScanNoHeaderSC2
      5194 13.68%   100%   runtime.mallocgc
         0     0%   100%   runtime.(*scavengerState).sleep
The top entry is one of Go 1.27’s size-specialised allocation routines, and the caller is the scavenger’s sleep loop. That is the runtime returning memory to the operating system, allocating a little to do so, and being caught by a profile that had nothing else to catch.
A reader arriving at that from a latency incident has been handed a name, a percentage and no problem.
The profile is a sample
MemProfileRate defaults to 524288 — approximately one sampled allocation per
512 KiB. churn’s live heap is 1.1 MiB, which is about two samples. The
table above is not a small profile; it is a rounding error with a legend.
Setting the rate to 1 makes it exact:
/tmp/heapprof -mode=churn -rate=1 -out=/tmp/churn-exact.pprofdefault rate 80ms inuse: 2050.06kB total, mallocgc 75.02%
rate=1 124ms inuse: 46.53kB total, mallocgc 89.69%Two things there. The exact profile is 55% slower to produce, which is why the default is what it is. And the two disagree about the size of the live heap by a factor of 44 — the sampled one extrapolates from two samples and gets it wrong, in the direction of too much.
The other axis
alloc_space and inuse_space are one axis; _objects and _space are the
other, and the second one catches a different bug. Bytes tell you what the
allocator moved; object counts tell you how many times it was asked.
retain’s numbers make the pairing visible: 8,030 objects for 31.93 MB is
about 4 KiB each, which is the buffer size, so the two rankings cannot
disagree. They disagree whenever a program allocates a few large things and
many small ones — a 16 MB slice and a million 24-byte structs put different
functions at the top of the two lists, and the per-call cost of an allocation
barely tracks its size below 80 bytes
anyway.
The rule of thumb that survives measurement: read _space when you care about
the heap’s size, _objects when you care about how hard the allocator is being
worked. GC pressure is closer to the second one, because the collector’s cost
scales with the number of objects it has to mark rather than with their bytes.
Which question you are asking
The two profiles answer two questions and the useful discipline is to name the question first.
“Why is my GC running so often?” is alloc_space and alloc_objects. You
are looking for churn, and the live set is irrelevant — the collector’s
frequency is set by allocation rate against the heap goal, which is
the knob rather than the
profile. inuse_space cannot show you this and will point somewhere else with
complete confidence.
“Why does my heap keep growing?” is inuse_space and inuse_objects. You
are looking for retention, and the allocation rate is irrelevant — a leak is
usually not the thing that allocates most often, it is the thing that lets go
least.
The programs above are the two extremes, and a real service sits between them
with both problems at once. The thing worth taking from a synthetic case this
lopsided is the arithmetic: compare alloc_space against inuse_space
before reading either. 782 MiB against 1.1 MiB is a churn problem. 33.0 MiB
against 32.5 MiB is a retention problem. The ratio decides which profile is
worth opening.
What this does not measure
Allocation rate over time. Both profiles here are cumulative to a single instant, so neither shows that the churning program did its allocating in an 80 ms burst — that is a time series or an execution trace, and a heap profile is neither.
The two programs are also lopsided on purpose, which makes the contrast legible
and the sampling problem worse than a real service would see. A program with a
200 MiB live heap gets a perfectly usable inuse profile at the default rate;
the two-sample failure above needs a live set small enough to be a rounding
error, and I built one deliberately.
And nothing here says what to do about either finding. A churn problem might be
a sync.Pool, a reused buffer, or a value that never needed to be a pointer —
and that last one is decided before allocation,
not after.
Frequently asked
What is the difference between alloc_space and inuse_space in a Go heap profile?
alloc_space is everything allocated since the process started, whether or not it is still reachable. inuse_space is what was still live at the moment the profile was taken. A program that allocates fast and keeps nothing has a large alloc_space and a nearly empty inuse_space; a program that accumulates has both, and they look the same. The gap between them is your garbage, and its size tells you which of the two questions is worth asking.
Which heap profile sample type should I use?
Decide what you are diagnosing first. GC pressure and allocation rate are alloc_space and alloc_objects — you are looking for churn, and inuse_space will not show it. A heap that grows and does not come back down is inuse_space — you are looking for retention, and alloc_space will point at whatever allocates most often, which is usually not the thing holding on.
Why does my heap profile show runtime functions instead of mine?
Usually because there is not much of your program left to show. When the live set is small, what survives a collection is disproportionately the runtime's own structures, and they fill the top of an inuse profile by default. In the run below inuse_objects reported runtime.mallocgcSmallScanNoHeaderSC2 at 86.32%, reached from the scavenger — a real allocation, in the runtime, and nothing to do with the program's problem.
Does MemProfileRate matter?
It decides whether the profile means anything. The default samples approximately one allocation per 512 KiB, so a live heap of 1.1 MiB is around two samples and the resulting profile is arbitrary. Setting runtime.MemProfileRate = 1 before the first allocation makes it exact and costs about 55% more wall time on the program below — worth it for a diagnosis, not for production.